Hey @Nic30,
I am a hardware engineer and loved your work. I constantly use for debugging test fails. I want to integrate this as part of my React JS project and have some feature requests which would really help the way I use this for debugging fails:
-
The vertical bar on the waveform should only be rendered when clicked. It’d be nice if it snap to the point where the signal value changes whenever user clicks close to it. We usually want to check what cause the signal to change on the active edge of the clock
-
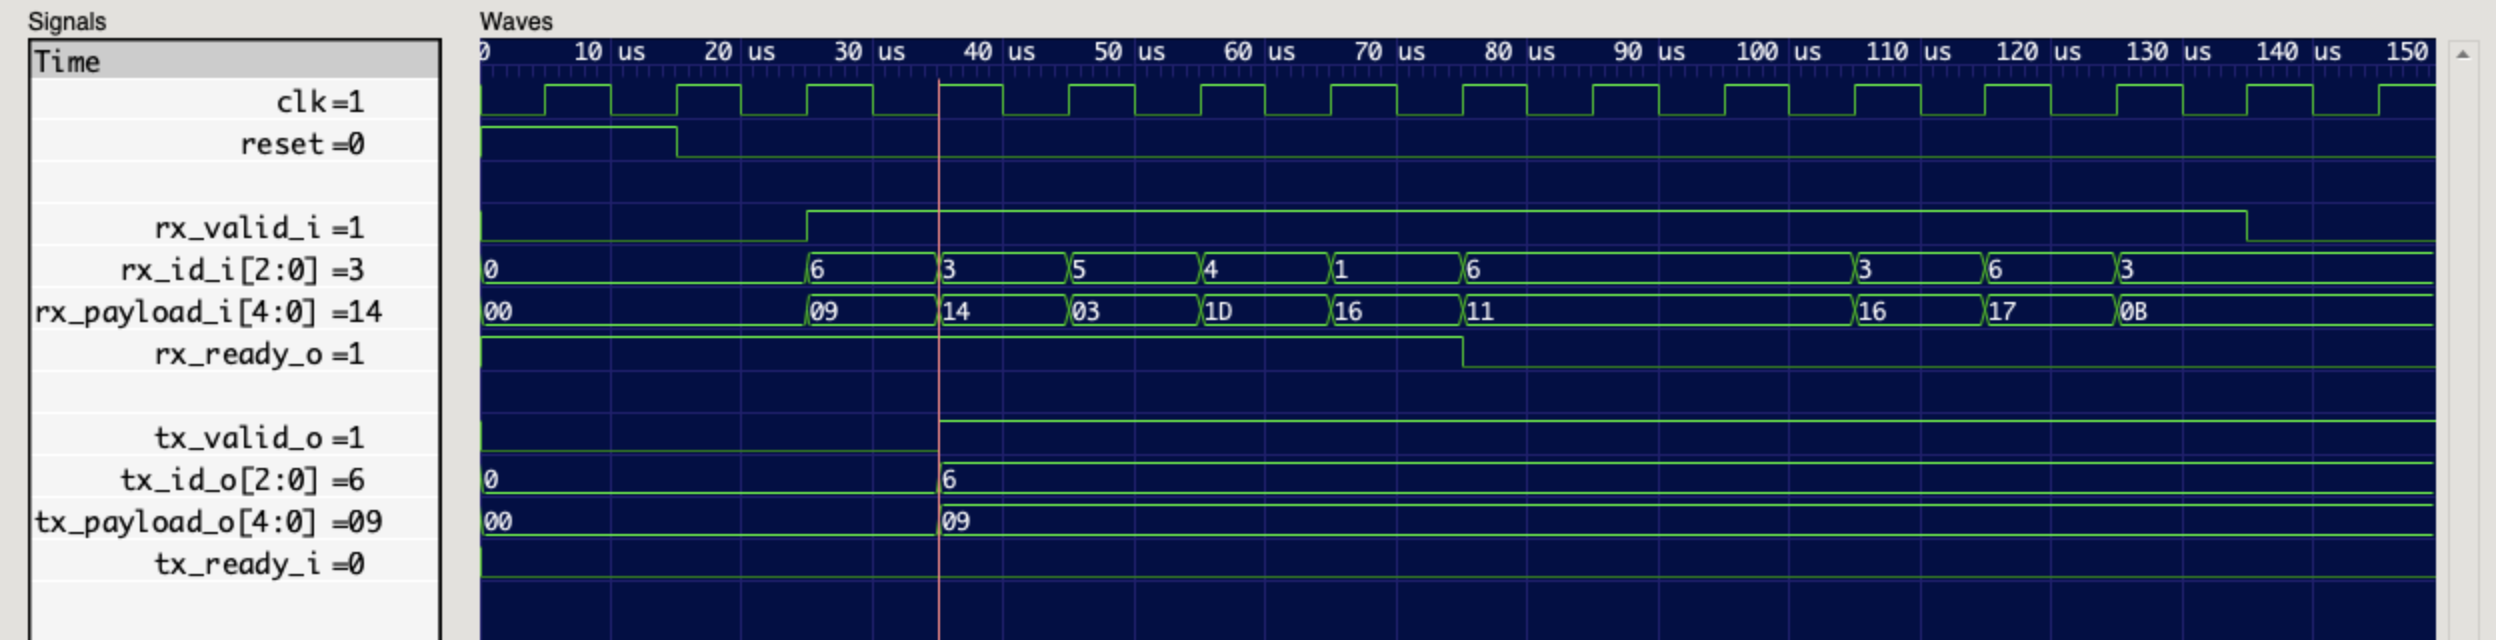
Show signal values along with signal names as seen in the picture below
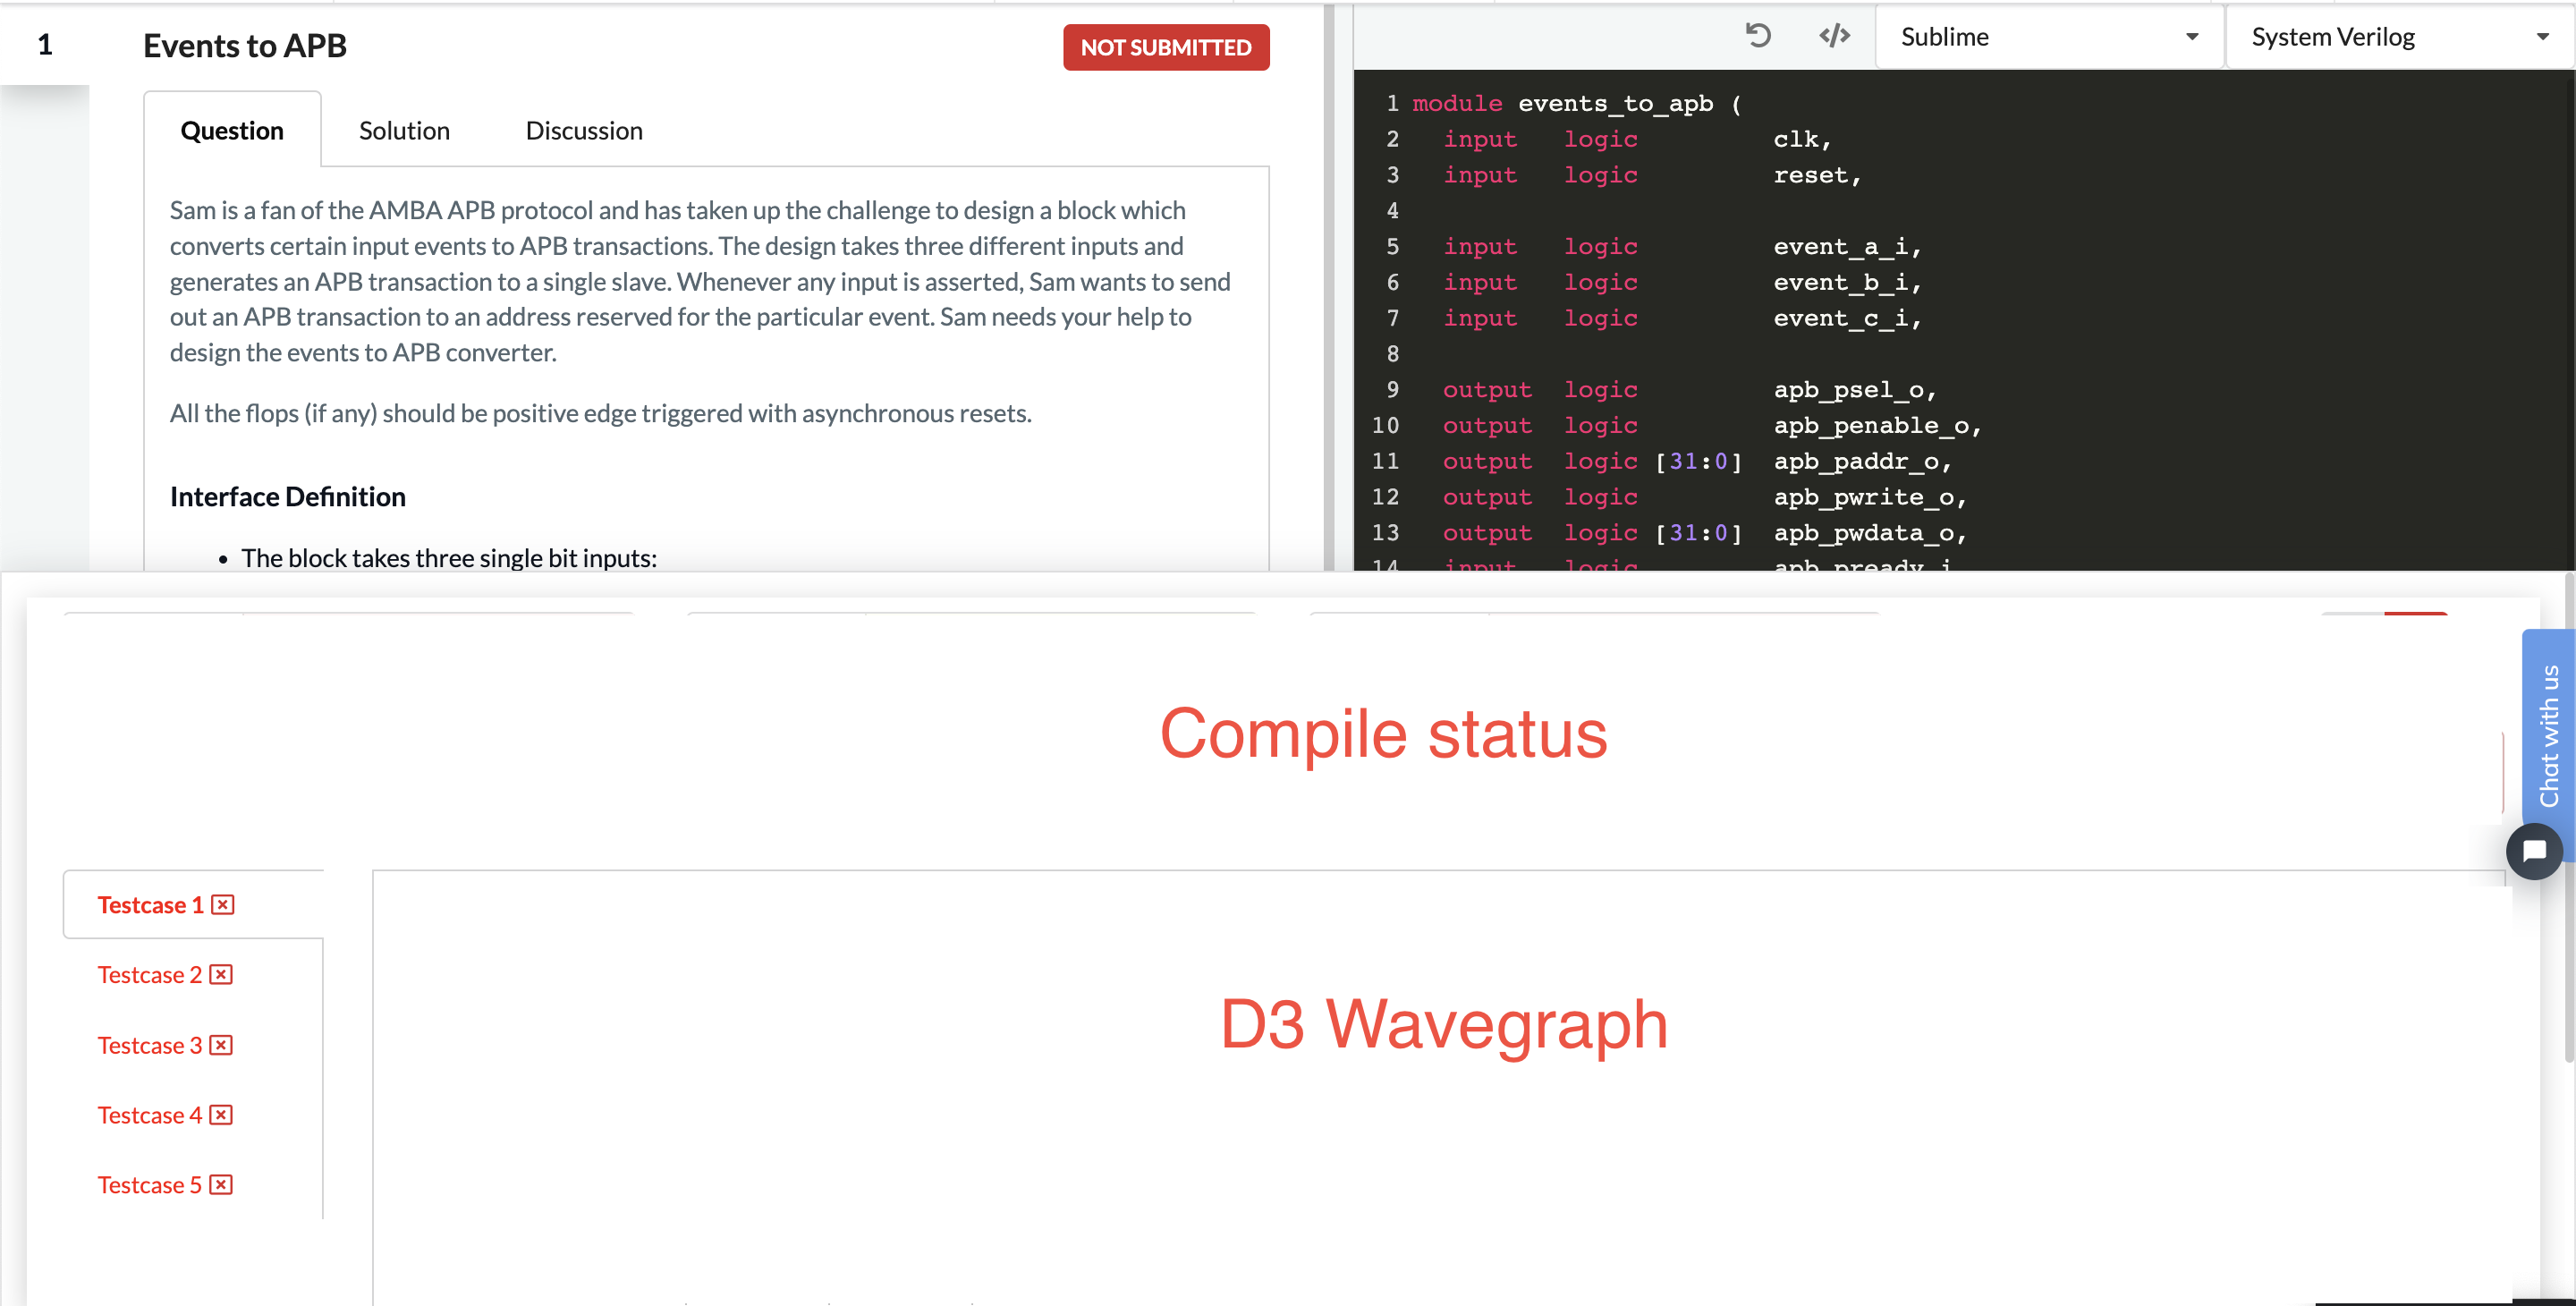
PS: I’m beginning to learn react and wanted to render the wavegraph in the space marked as waveform below:
I tried coding it as:
import { WaveGraph } from 'd3-wave.git';

<script type="text/javascript">
  var svg = d3.select("#wave-graph");
  var waveGraph = new WaveGraph(svg);
  waveGraph.setSizes();
  waveGraph.bindData(JSON.parse(contents));
</script>
But it didn’t work. Any ideas on what would be the best to render wavegraph inside a react js project?
Hey @Nic30,
I am a hardware engineer and loved your work. I constantly use for debugging test fails. I want to integrate this as part of my React JS project and have some feature requests which would really help the way I use this for debugging fails:
The vertical bar on the waveform should only be rendered when clicked. It’d be nice if it snap to the point where the signal value changes whenever user clicks close to it. We usually want to check what cause the signal to change on the active edge of the clock
Show signal values along with signal names as seen in the picture below
PS: I’m beginning to learn react and wanted to render the wavegraph in the space marked as waveform below:
I tried coding it as:
But it didn’t work. Any ideas on what would be the best to render wavegraph inside a react js project?