Advanced Sankey diagrams for flows that outgrow Qlik's native chart.
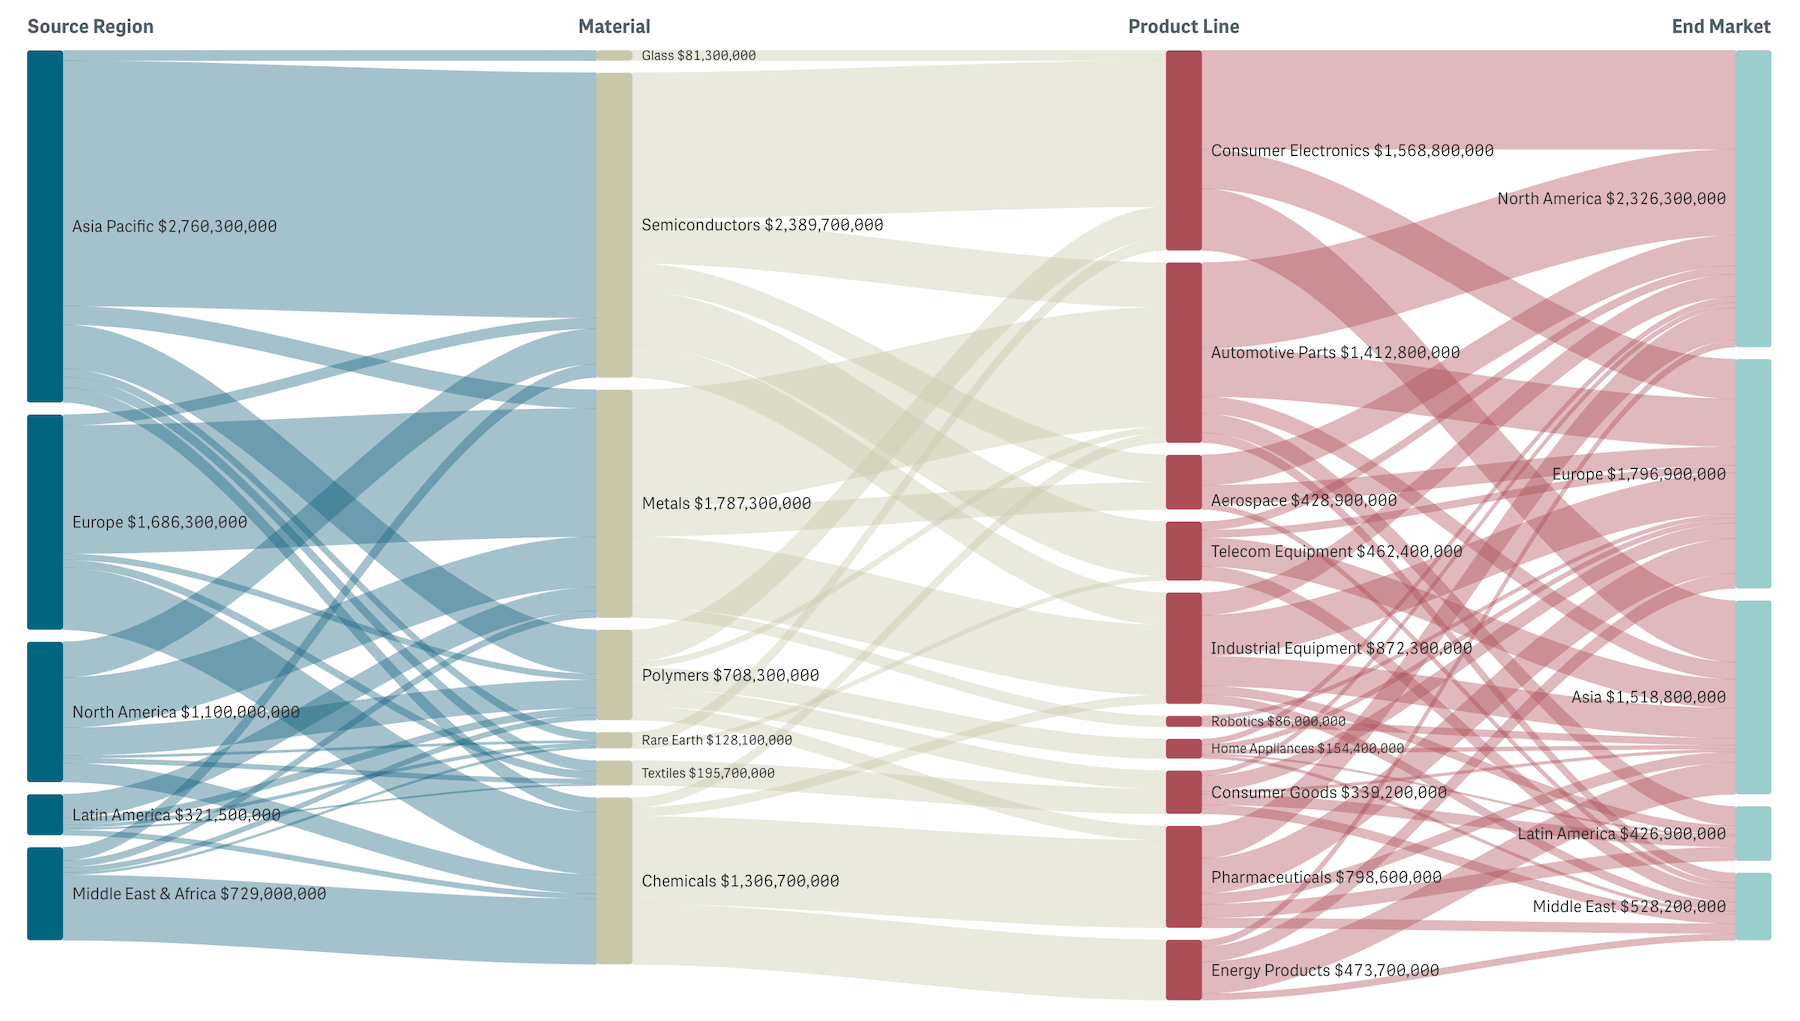
The Sankey Chart extension by AnyChart is built for multi-stage flow analysis when the native chart runs out of room. It accepts up to ten dimensions instead of five, supports full source-and-target selection on link click, and adds richer visual context for value flows. Available in Qlik Cloud, Qlik Sense Enterprise on Windows, and Qlik Sense Desktop.
- Budget allocation and cost analysis
- Supply chain analysis
- Customer journey mapping
- Energy and resource flows
- Website traffic and conversion funnels

- Up to 10 dimensions, with one measure sizing the flows
- Dual-end flow selection: click a link, both source and target select
- Gradient, source-color, target-color, or single-color links
- Node coloring by dimension level, unique per node, or single color
- Level headers labeling each column
- Detailed tooltips for income, outcome, dropoff, and flow shares
- Layout sliders for node width, spacing, and link curvature
- Standard Qlik integration: master dimension colors, calculation conditions, story snapshots, image and data exports, locale-aware number formatting
➡️ Get the extension + Manage your trial & license
Distributed under a commercial license.
Built and maintained by AnyChart, Qlik's Technology Partner.
Discover more extensions for Qlik Sense from AnyChart at qlik.anychart.com, including:
- Excel-Style Spreadsheets
- Decomposition Tree with AI Splits
- Circular Dendrogram
- Gantt Chart (Project & Resource)
- Sunburst Chart
- Waterfall Chart with stacked bars
- Bullseye Chart
- and more.
Missing a chart type in Qlik for a specific business case? We're ready to build it for you.