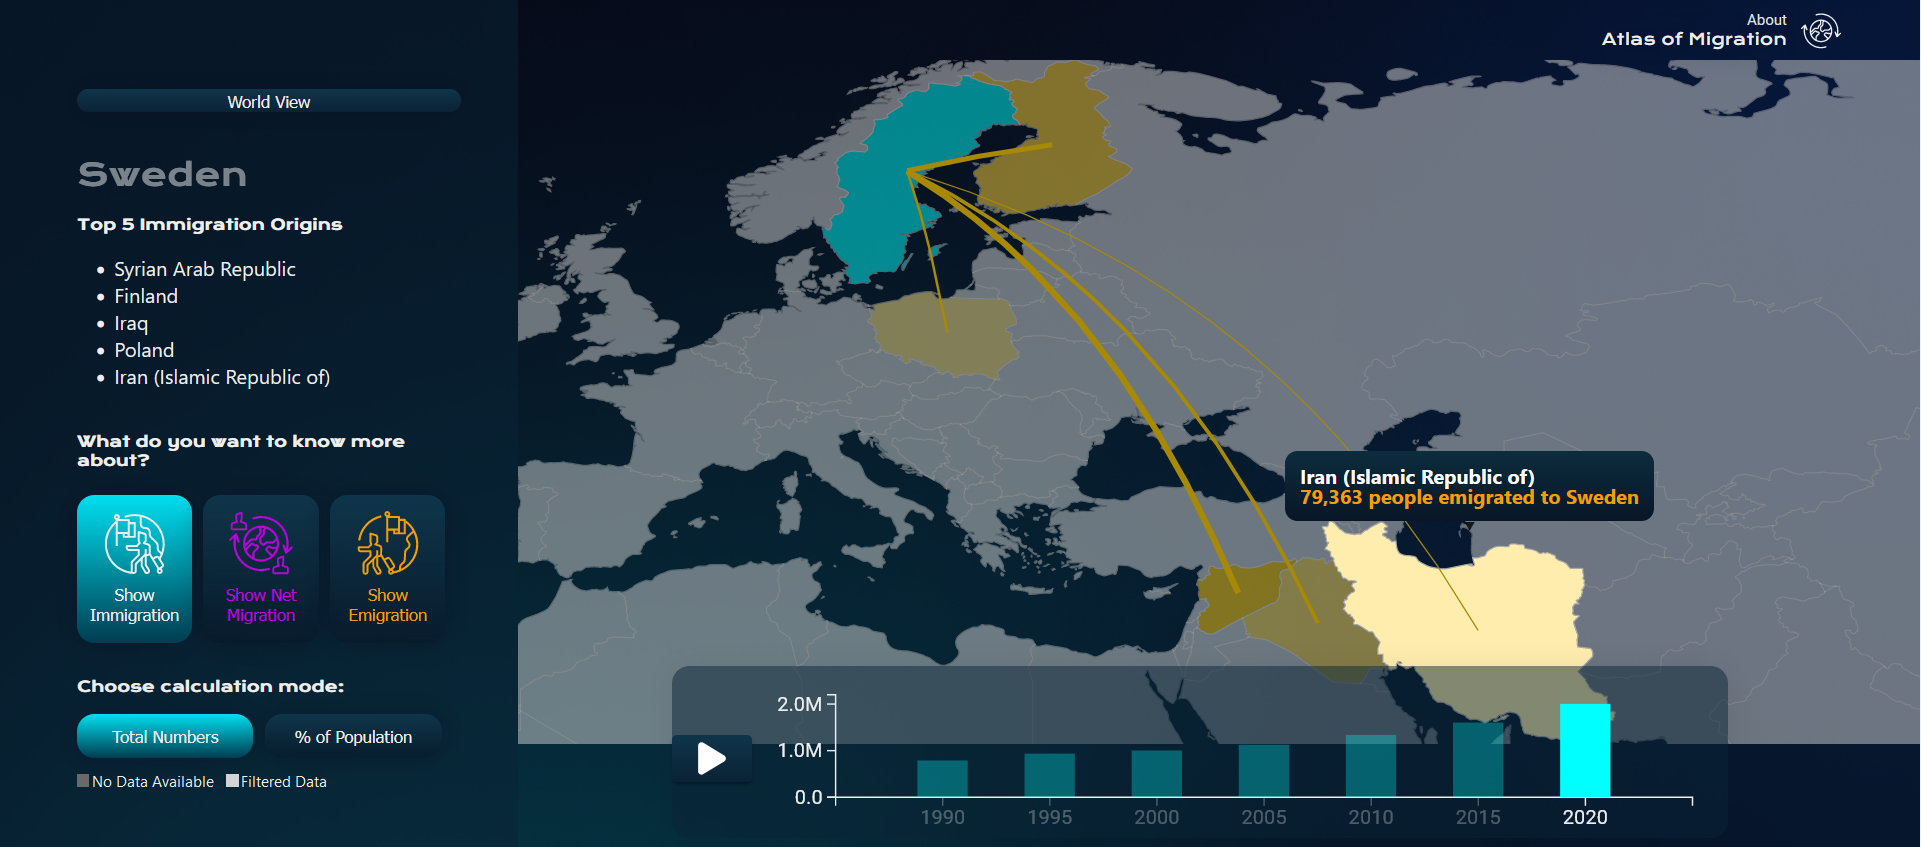
A website which visualizes the Migration Data of the UN on a world map over time. D3.js and React were used for the implementation.
This project was developed in cooperation with Fatemeh Bakhshoudeh, Navya Sanjna Joshi, Anna Neander and Andrea Maderthaner during the course Information Visualization at KTH from February to March 2022.
The motivation of this project was to fight misconceptions about the migration pattern and trends. Our website represents historical migration information of the world and each country in detail (from 1990-2020) and can be used for explorative analysis.
During this project I learned to use D3 and React, as well as how to handle and visualize big datasets.
Try it out: https://lariwa.github.io/AtlasOfMigration/