The election audit for the US Congressional Precinct, Colarado was analysed with the help of Python.
The purpose of the challenge is to analyse the election data which was presented in a .csv (Comma Seperated Version) file format using Python. The analysis yeilded,
- The total number of votes casted.
- The voter turnout for each county.
- The percentage of votes from each county out of the total count.
- The county with the highest turnout.
- The percentage and the number of votes for each candidate.
- The winner with their vote count and percentage.
The source data for the analysis contains
- Ballot ID
- Candidate Name
- County Name
It can be viewed here: https://github.com/Malvi1497/Election_analysis/blob/main/election_results.csv
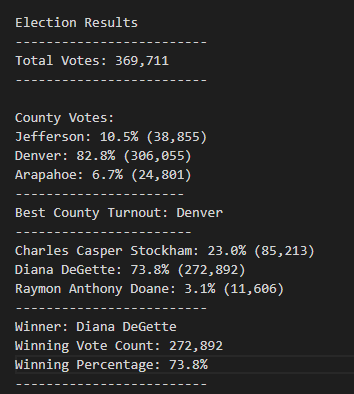
- The results show that the total number of votes casted was 369,711 with Denver having the highest turnout of about 82.8% (306,055 votes) and the lowest turnout was Arapahoe with only won 6.7% (24,801) of the total votes closely precceded by Jefferson who won 10.5% (38,855) of the total votes.
- The winner of the election is Diana DeGette securing almost 73.8% (272,892) of the total votes. She won with a big leap when compared to her competitors Charles Casper Stockham, who received 23% (85,213) of the total votes and Raymon Anthony Doane who received only 3.1% (11,606) of the overall votes.
There are many ways to use Python to perform further analysis with additional data,
- We can use the same scripting with data from 50 states to perform the same for state elections.
- With additional data, such as demographics and geographical locations, scripting can be changed in a way to determine the geographical significance of each candidate to check their popularity.
- With additional data such as bypoll results we can also determine and compare the difference in the actual results with the bypoll reults.