Our task was to create a purchasing power parity index for a good of our choice. You can read about purchasing power parity here: https://en.wikipedia.org/wiki/Purchasing_power_parity. We chose to create an index for flour pricing because it is a basic good consumed in all countries which allows us to find interesting insights about how certain aspects of the world work.
1. Importing pricing data on the flour product into a table from 'https://www.globalproductprices.com/rankings/flour_prices/'
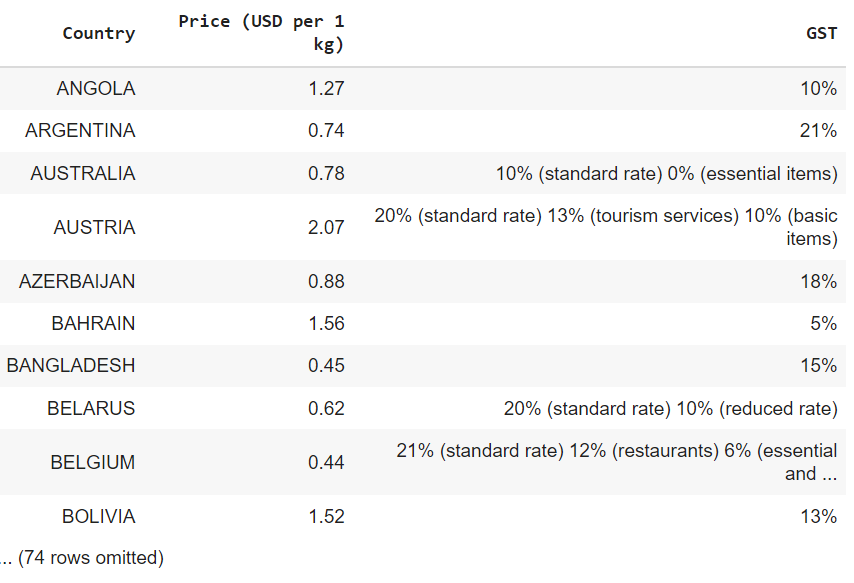
First, we scraped our data from its' source using the beautiful soup module in python and then cleaned the data into a table containing the countries and their prices per 1kg of flour. Here is a look at the table we have created:

In this step, we found a csv file from https://www.kaggle.com/datasets/mathurinache/list-of-countries-by-tax-rates of local tax rates for which we will apply to the flour pricing to obtain the after-tax pricing for flour in each country. We then joined the table from step 1. Here is what the table looks like:
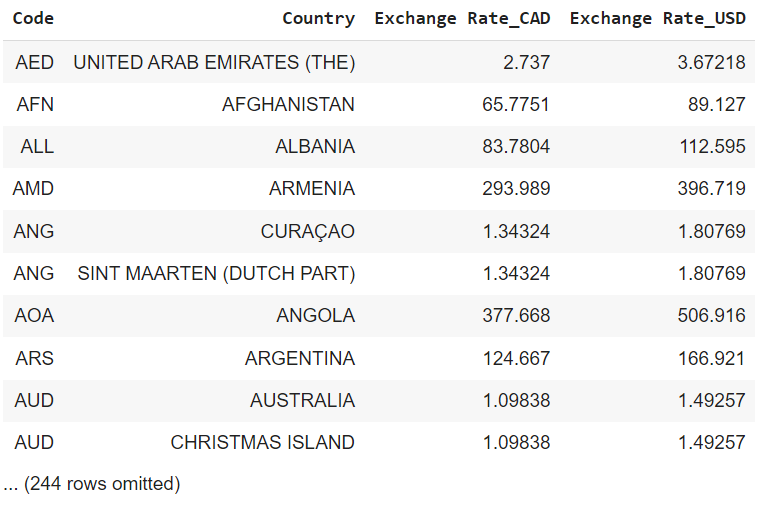
We were able to find and scrape from an API to obtain a table of the exchange rates in canada and USA for each country and the currency codes used to define each currency. This is the API we used:https://api.exchangerate.host/latest. We then found scraped this table https://www.iban.com/currency-codes to get each country with their respective currency code and after dropping some columns, we joined the tables into one singular table containing country code, country, exchange rate in CAD and exchange rate in USD. Here is what that table looks like:
4. Next, we imported the data on the external factors which we believe may have an impact on the price discrepancies between the different countries.
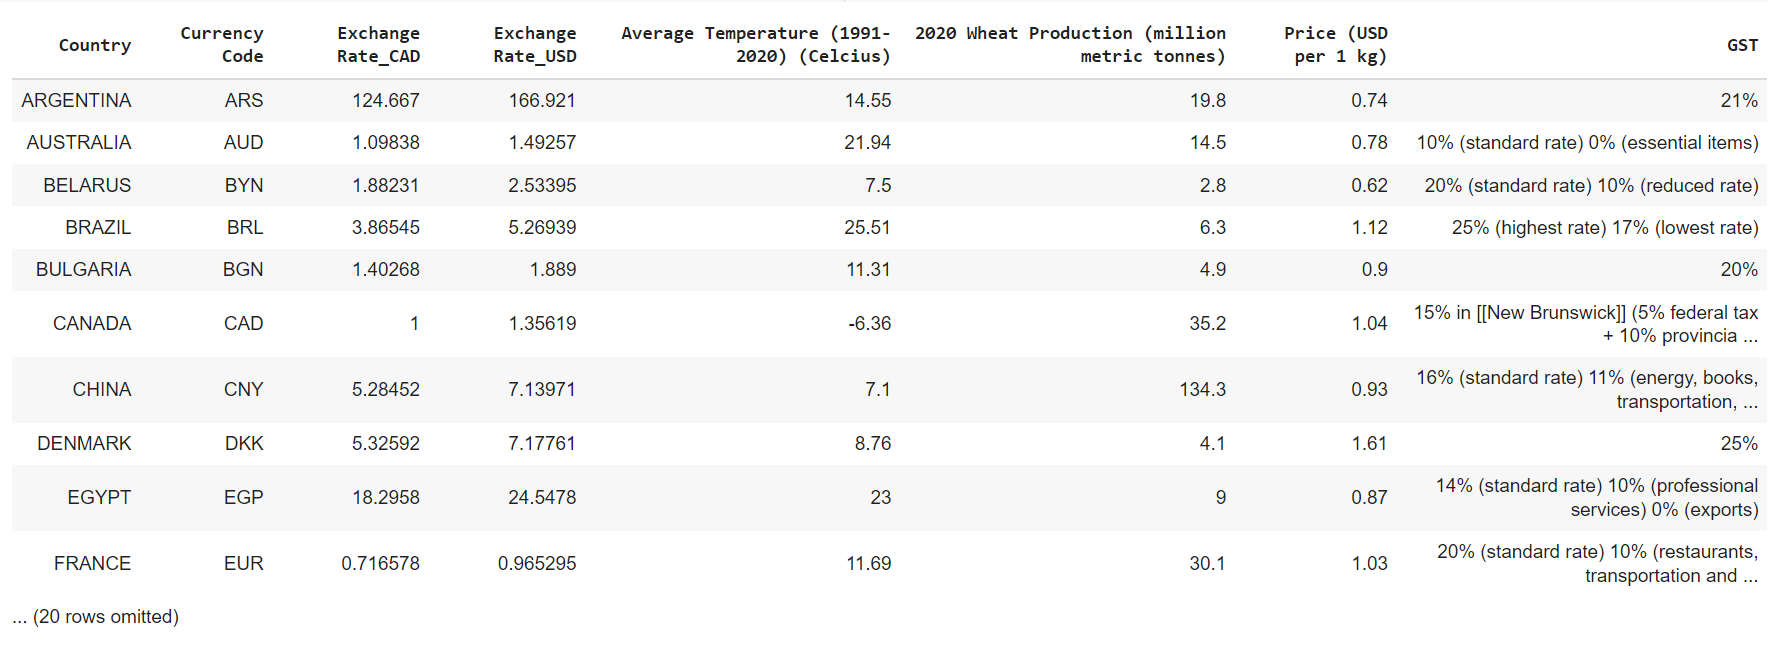
The two external factors that we chose to examine are temperature, and wheat production. In order to do our analysis, we scraped a table from https://listfist.com/list-of-countries-by-average-temperature which shows the average temperatures (in celcius) of each country between 1991 and 2020. We also did the same for our second external factor (wheat production) which came from https://en.wikipedia.org/wiki/International_wheat_production_statistics. We then joined all of our tables at this point which you can see here:
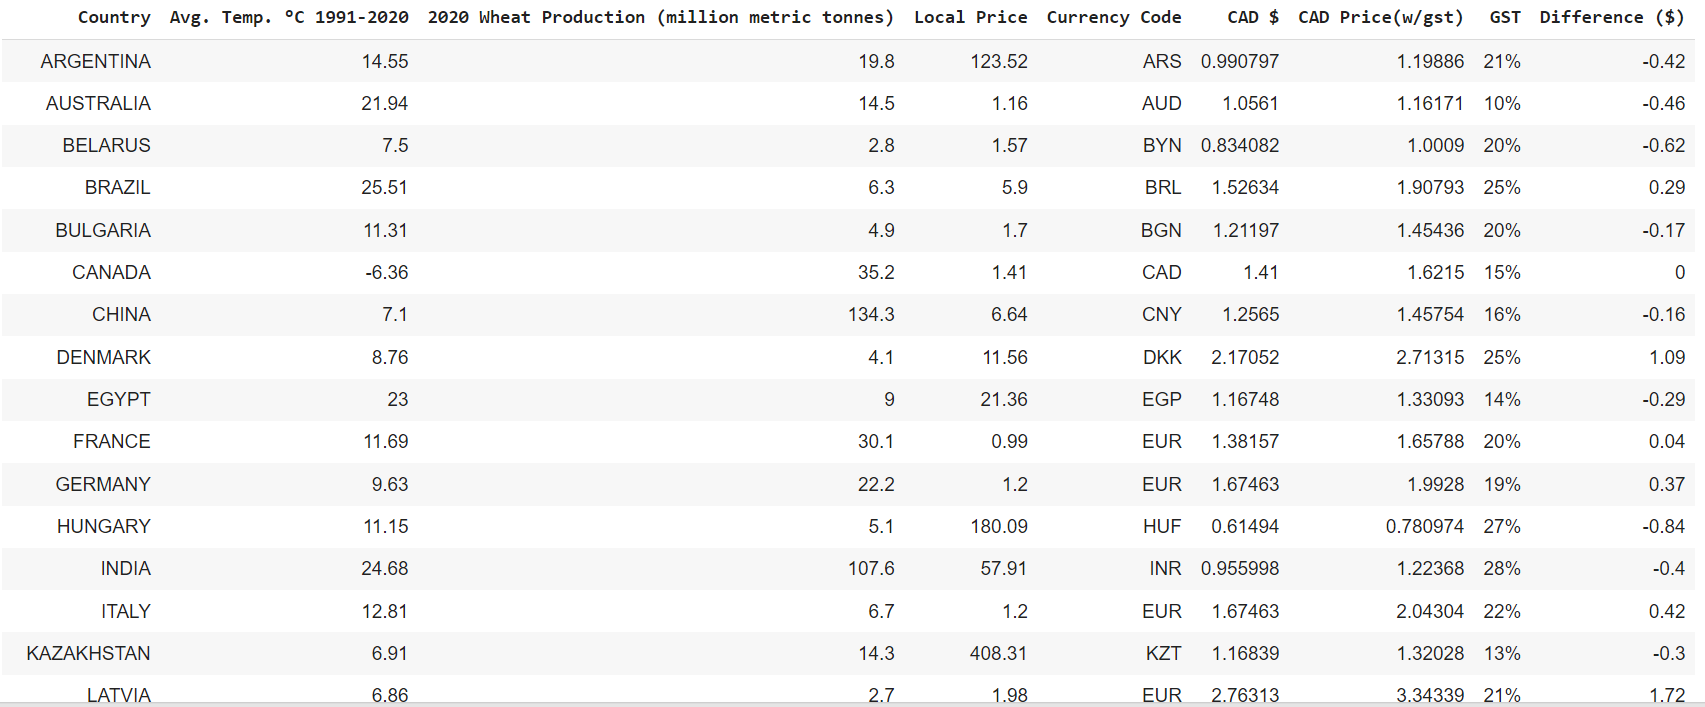
In this part, we first cleaned the GST column by taking only the first 3 elements of the string from each row. In that way, we get either the highest or the standard GST for each country. After that, we get local prices in each country by multiplying their price in USD with the conversion rates based on USD. To obtain the CAD price excluding GST, we divided the local price with conversion rates based on CAD. To get the CAD price with gst, we stripped the '%' sign, divided by 100, added 1 and multiplied with CAD price. After that, we dropped conversion rate columns. Lastly, in order to achieve a difference in price between the Canadian price the other countries' prices, we first get the Canadian price from the table and subtract it with the 'CAD Price(w/gst)' column.
We now have our fully clean tables that we will use to do our analysis on:
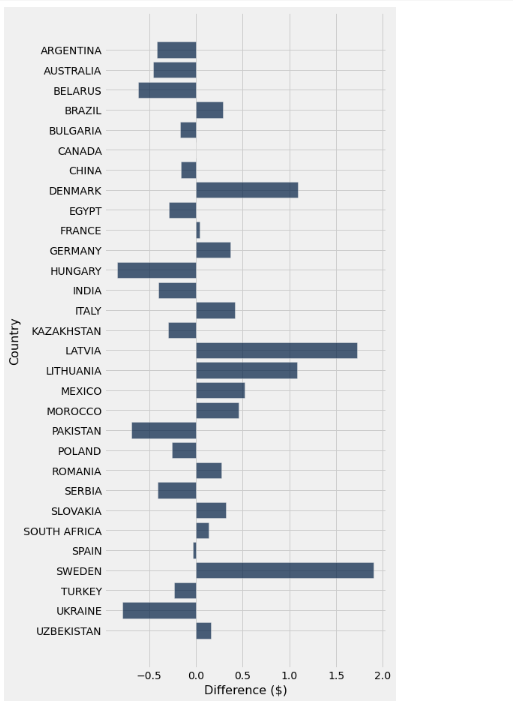
Using a bar chart, we have found that the countries with differences greater than $1/kg relative to Canada are: Sweden, Latvia, Denmark, and Lithuania. Additionally, the countries with differences less than $0.5/kg relative to Canada are: Hungary, Ukraine, Pakistan and Belarus. You can see these differences in our bar chart below!
Next, we scattered these differences against both wheat production and average temperature. We found a coefficient of correlation for price-production and price-temperature to be -0.257 and -0.275 respectively. Here are the scatterplots:
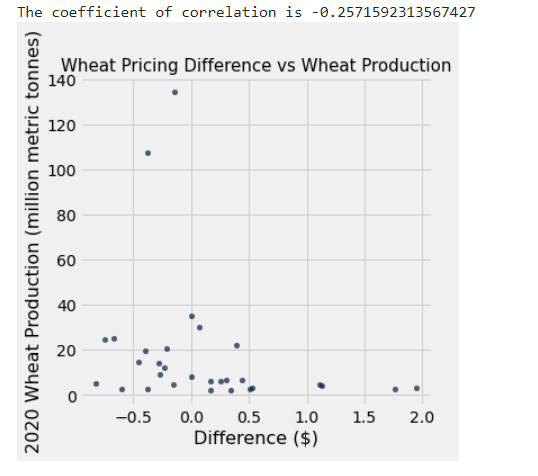
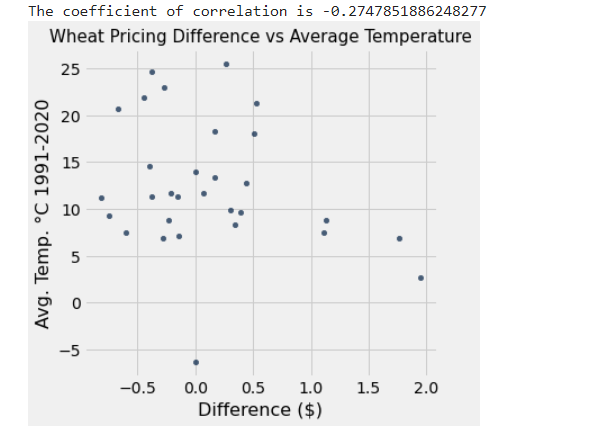
Based on the scatterplots and the bar chart above, we would say that there is some negative correlation between the two external factors, (wheat production and temperature). This means that we have potentially found something interesting about our data, however, in order to properly examine whether or not this is a root cause of pricing inflation or deflation for flour, further analysis would be required. For example, another potential factor on flour pricing could be politcal trade agreements like the United-States-Mexico-Canada Agreement (USMCA), or other political institutions.
One thing that we found to be a challenge in this process with our data cleaning is that we lost many of the countries that we may have found interesting insights from because they were not matched in both tables when joining and hence, were dropped. So, in the end, we only had 30 countries left which included most of the predominant countries, however, we excluded 165 other countries.