Code Repository for the Bootcamp conducted on 22nd August, 2021 with Uttam Grade (Data Scientist, McKinsey & Company)
- Introduction to Python
- An overview into Numpy & Pandas
- Data Visualisation
- Exploratory Data Analysis
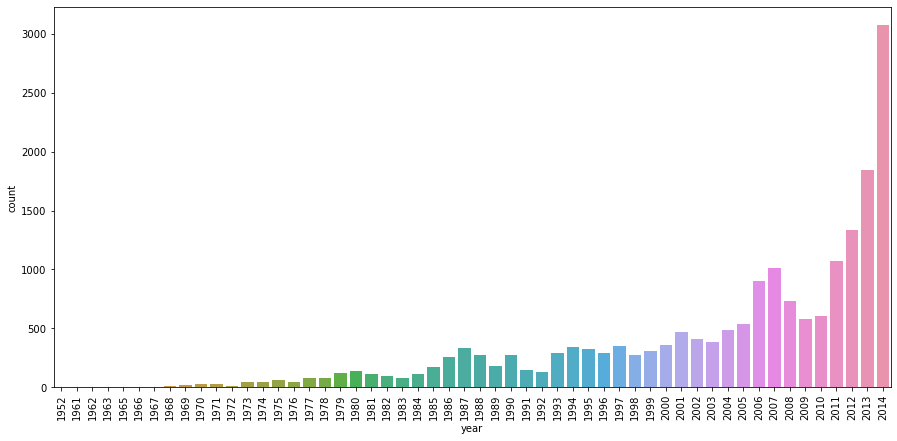
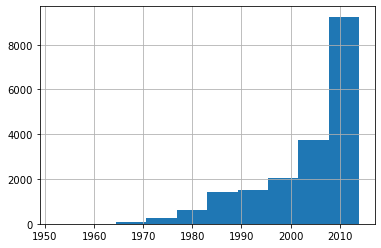
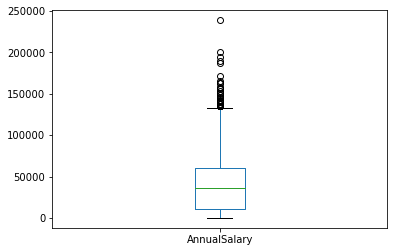
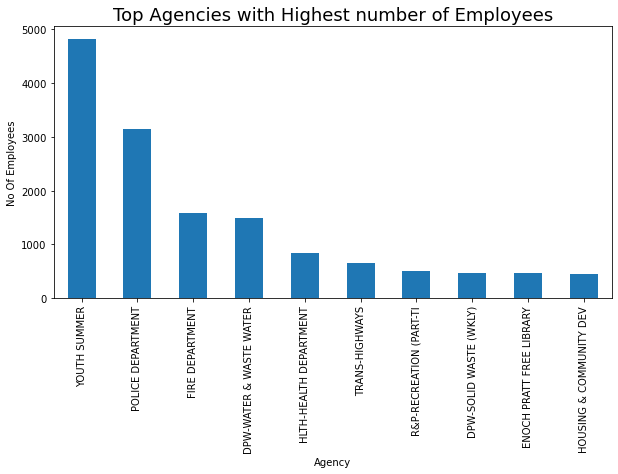
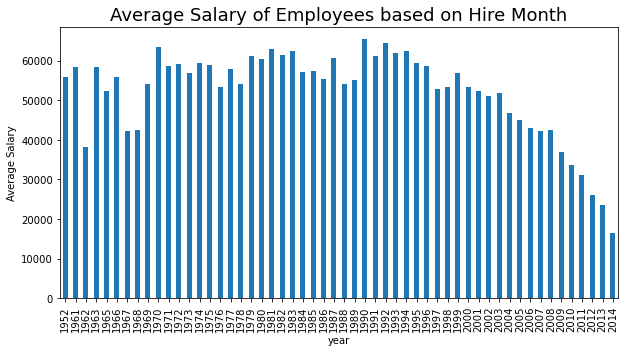
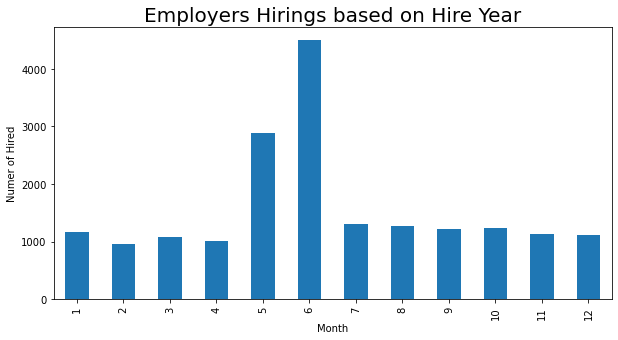
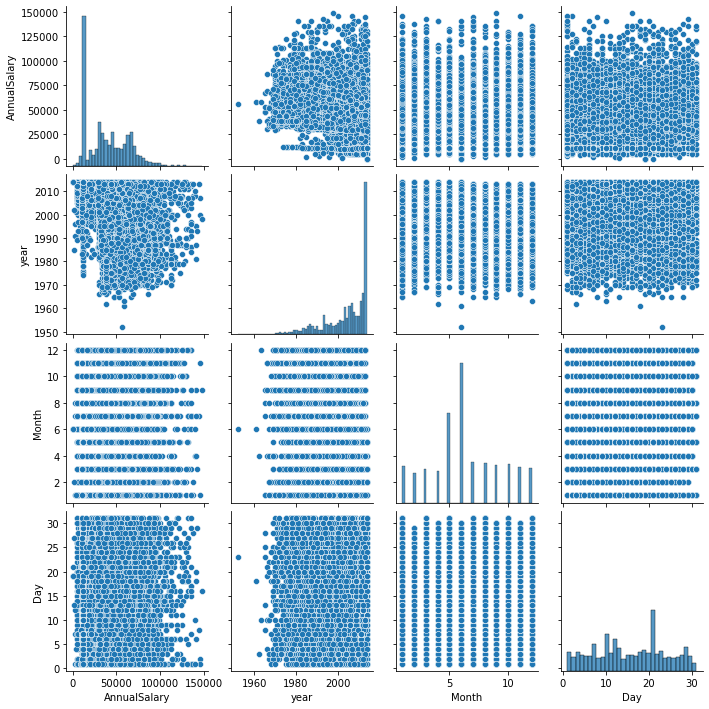
Given a data set which captures gross salary from July 1, 2013 through June 30, 2014 and includes only those employees who were employed on June 30, 2014 Predict the Salaries for Employees in Blatimore. The Dataset used in this repository is Baltimore City Employee Salaries FY2014 and can be downloaded from this link.
Cleaning & preparation measure applied to the dataset are listed below.
- Remove leading and trailing edges
- Check Null Values in data set
- Remove rows having empty hire date
- Drop Gross Pay column
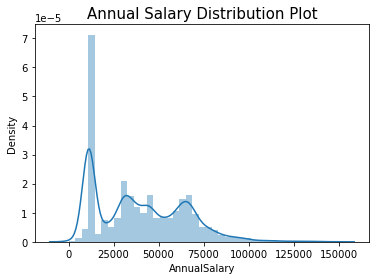
- Remove $ from Annual Salary and converting it into Integer format
- Trim spaces
After all these transformations the dataframe shall appear in the format given below.

- Apply mean encoding for Job Title
- Apply mean encoding for Agency
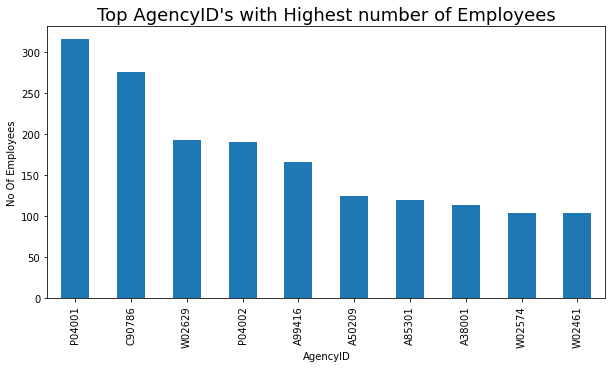
- Apply mean encoding for AgencyID
- Divide tarin set into Dependent and independent variables
- Divide test set into Dependent and independent variables
- Scale the train, test
There are two types of scaling
- Standard Scaling
- MinMax Scaling
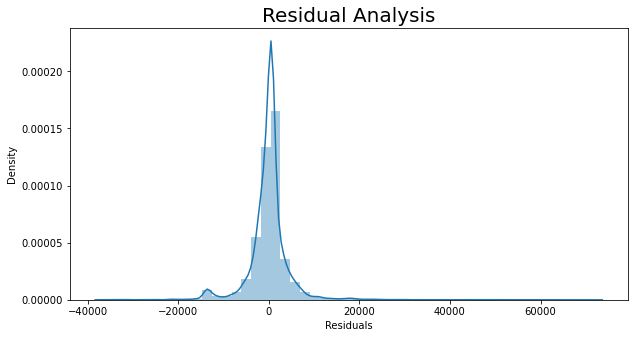
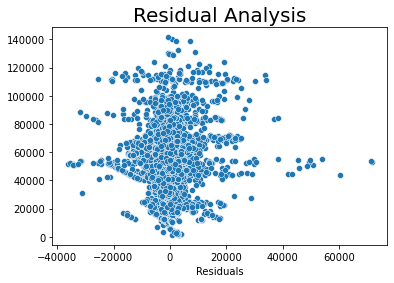
We have used Linear Regression model.