Render static map images from Python using MapLibre Native.
Platform: Linux x64, ARM64
Python: 3.12+
Uses the maplibre-native Rust crate for high-performance native rendering.
pip install mlnativefrom mlnative import Map
from geopy.geocoders import ArcGIS
# Geocode an address
geolocator = ArcGIS()
location = geolocator.geocode("San Francisco")
# Render map at that location
with Map(512, 512) as m:
png = m.render(
center=[location.longitude, location.latitude],
zoom=12
)
open("map.png", "wb").write(png)- Zero config - Works out of the box with OpenFreeMap tiles
- HiDPI support -
pixel_ratio=2for sharp retina displays - Batch rendering - Efficiently render hundreds of maps
- Address geocoding - Built-in support via geopy
- Custom markers - Add GeoJSON points, lines, polygons
Different OpenFreeMap styles (rendered from "Sydney Opera House"):
| Liberty (default) | Positron (light) | Dark Matter |
|---|---|---|
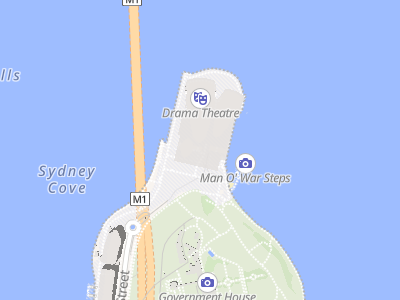 |
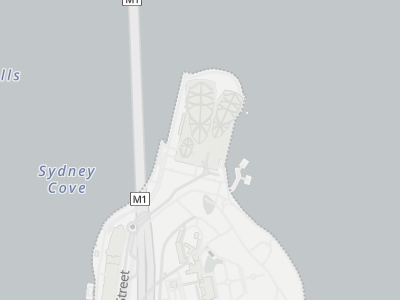 |
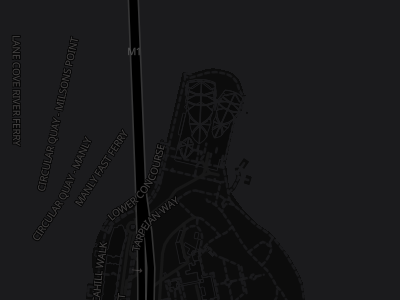 |
Styles from OpenFreeMap
Same location, different pixel ratios:
| Standard (1x) | HiDPI (2x) |
|---|---|
| 400x300 px | 800x600 px |
Both displayed at 200px width. The 2x version has 4x more pixels for sharper details.
Both images show the exact same geographic area. The 2x version has 4x more pixels for sharper text and details on retina displays.
from mlnative import Map
from geopy.geocoders import ArcGIS

geolocator = ArcGIS()
location = geolocator.geocode("Sydney Opera House")

with Map(512, 512) as m:
    png = m.render(
        center=[location.longitude, location.latitude],
        zoom=15
)from mlnative import Map, feature_collection, point
# Show multiple locations
markers = feature_collection([
point(-122.4194, 37.7749), # SF
point(-122.2712, 37.8044), # Oakland
])
with Map(800, 600) as m:
# Load style as dict to modify it
style = {"version": 8, ...} # your style
m.load_style(style)
m.set_geojson("markers", markers)
# Fit map to show all markers
center, zoom = m.fit_bounds(
(-122.5, 37.7, -122.2, 37.9), # xmin, ymin, xmax, ymax
padding=50
)
png = m.render(center=center, zoom=zoom)from geopy.geocoders import ArcGIS
geolocator = ArcGIS()
# Geocode multiple cities
cities = ["London", "New York", "Tokyo"]
locations = [geolocator.geocode(city) for city in cities]
# Create views for each city
views = [
{"center": [loc.longitude, loc.latitude], "zoom": 10}
for loc in locations
]
with Map(512, 512) as m:
pngs = m.render_batch(views) # Returns list of PNG bytes
# pngs[0] = London, pngs[1] = New York, pngs[2] = TokyoUse pixel_ratio to render high-resolution images for crisp display on retina/HiDPI screens.
from geopy.geocoders import ArcGIS

geolocator = ArcGIS()
location = geolocator.geocode("Paris")

# Standard display (1x) - 512x512 image
with Map(512, 512, pixel_ratio=1) as m:
    png = m.render(
        center=[location.longitude, location.latitude],
        zoom=13
    )

# Retina/HiDPI display (2x) - 1024x1024 image
with Map(512, 512, pixel_ratio=2) as m:
    png = m.render(
        center=[location.longitude, location.latitude],
        zoom=13
    )
    # Same geographic area, but text appears sharper
Key points:
pixel_ratio=2creates an image 2x larger in each dimension (4x total pixels)- Shows the exact same geographic area as
pixel_ratio=1 - Text, icons, and lines are rendered sharper, not smaller
- Common values: 1 (standard), 2 (retina), 3 (ultra-HD)
Create map renderer. Context manager ensures cleanup.
Parameters:
width,height: Output dimensions in CSS/logical pixelspixel_ratio: Scale factor for HiDPI (1=normal, 2=retina, 3=ultra-HD)- Output image dimensions will be
width × pixel_ratiobyheight × pixel_ratio - Geographic coverage remains the same regardless of pixel_ratio
- Output image dimensions will be
Render single view. Returns PNG bytes.
center:[longitude, latitude]zoom: 0-24bearing: Rotation in degrees (0-360)pitch: Tilt in degrees (0-85)
Render multiple views efficiently.
views = [
    {"center": [lon, lat], "zoom": z},
    {"center": [lon, lat], "zoom": z, "geojson": {"markers": {...}}},
]Calculate center/zoom to fit bounding box.
center, zoom = m.fit_bounds((xmin, ymin, xmax, ymax))
png = m.render(center=center, zoom=zoom)Update GeoJSON source in style (requires dict style, not URL).
m.set_geojson("markers", {"type": "FeatureCollection", "features": [...]})Load custom style (URL, file path, or dict).
# OpenFreeMap styles
m.load_style("https://tiles.openfreemap.org/styles/liberty")
m.load_style("https://tiles.openfreemap.org/styles/positron")

# MapLibre demo
m.load_style("https://demotiles.maplibre.org/style.json")

# Custom style dict
m.load_style({"version": 8, "sources": {...}, "layers": [...]})from mlnative import point, feature_collection, from_coordinates, from_latlng
# Create point
sf = point(-122.4194, 37.7749, {"name": "San Francisco"})
# From coordinate tuples
fc = from_coordinates([(-122.4, 37.8), (-74.0, 40.7)])
# From GPS (lat, lng) order
fc = from_latlng([(37.8, -122.4), (40.7, -74.0)])The pixel_ratio parameter controls the resolution of the output image:
| pixel_ratio | Output size | Use case |
|---|---|---|
| 1 | 512x512 → 512x512 | Standard displays |
| 2 | 512x512 → 1024x1024 | Retina/HiDPI displays |
| 3 | 512x512 → 1536x1536 | Ultra-HD displays |
- Higher
pixel_ratio= larger output image - Same geographic area shown regardless of pixel_ratio
- Text and icons scale properly (sharper, not smaller)
- fit_bounds() automatically accounts for pixel_ratio
- Default style: OpenFreeMap Liberty (no configuration needed)
- GeoJSON updates: Requires style loaded as dict, not URL
- Platform: Linux only (macOS/Windows builds disabled due to upstream issues)
See docs/CI.md for CI/CD setup and requirements.
Apache-2.0