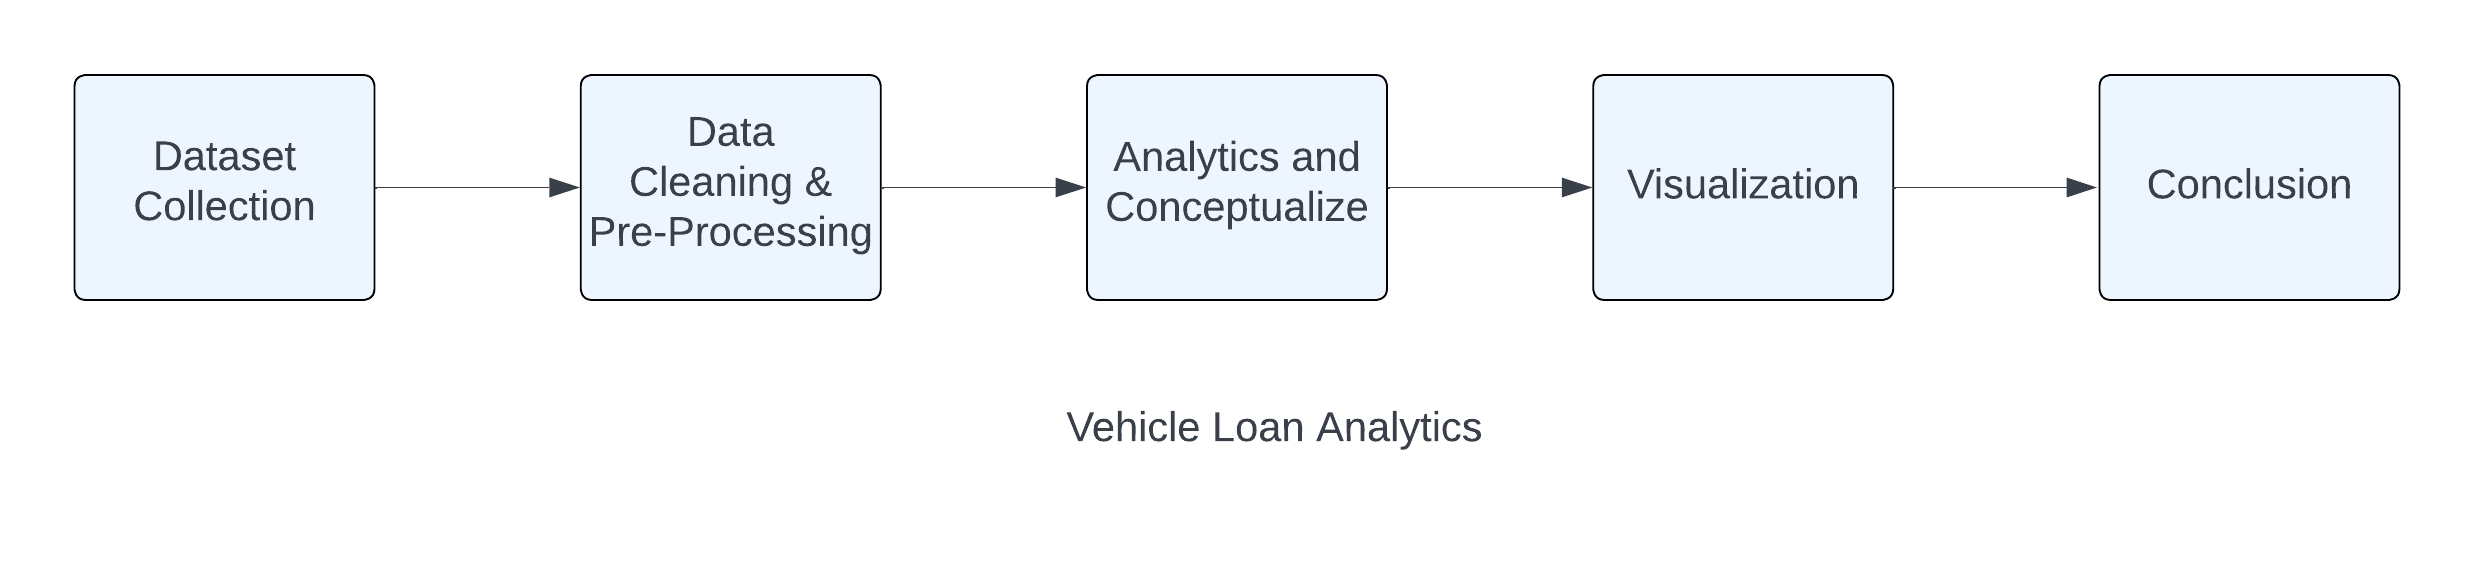
- This project is developed using Python, Dash, and Plotly. This gives Vehicle Loan Analytics using the dataset LoanPricing.csv available in this repository. The gender option triggers the callback to serve visualization in accordance with the selected option. I hope you guys like it :).
- The dataset contains 34 Features, 18969 tuples for Vehicle Loan Analytics.
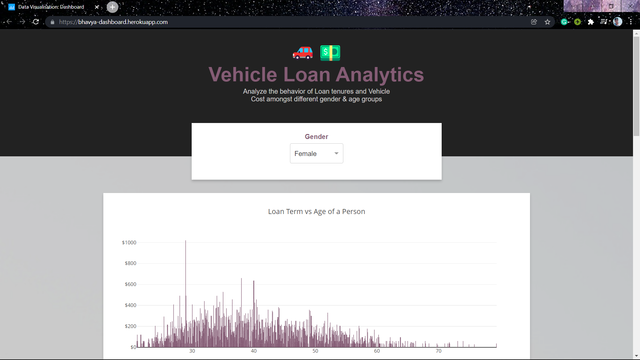
The input to the application is a dropdown for gender, according to the dataset this field is generated. Upon selection the callback gets triggered and updates the Dashboard in real time.
- Dropdown: Selection of Gender. Example: Female, Male.
- Output: We get 4 different visualizations on the basis of selected dropdown field of the dataset.
The app is now deployed at http://bhavya-dashboard.centralindia.cloudapp.azure.com/
-
Open the command prompt/terminal.
-
Clone the repo using
git clone https://github.com/bhavyatyagi/visualization-dashboard.git -
Go to the directory where the program is stored/cloned
-
Type:
python3 app.py -
The program will run
-
If it asks for missing libraries then do:
pip install requirements.txtOR
pip install dash pandas plotlyNote: pip3 instead of pip if in case shows command not found.
-
Run the program again via step 4.