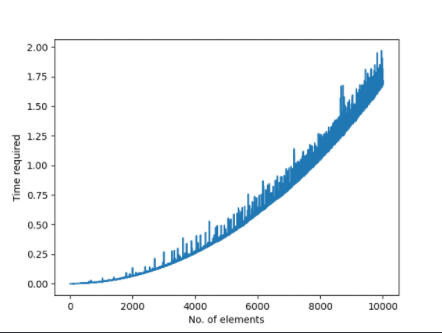
The algorithm calculates the Tukey depth of a point p with coordinates (0,0) in a set S. The size of the set S and the range in which the random points are generated can be changed easily. The run time according to the size of the input is then plotted in a .png image in the /plots subfolder.
For example, the output image for an input size of 10000 elements could look like this:
The implementation of this algorithm has been developed under WSL with Ubuntu. To run the code, you need to clone the repository for example via https with
git clone https://github.com/felixele217/algorithm-2d-tukey-depth.git
Then, you need to install python3, pip (a package manager for python packages) and the library matplotlib, which is needed for plotting the graph. In WSL, you can do this with the following commands:
sudo apt update && upgrade
sudo apt install python3 python3-pip ipython3
pip install matplotlib
The command
python --version
tells you, if you have successfully installed python.
After successfully installing python, create a virtual environment in the following way:
python3 -m venv /path/to/new/virtual/environment
To run the program, please navigate to the folder of the project in a terminal of your choice and execute the command
python3 main.py
For example, I am using Visual Studio Code and therefore I could run the program in my integrated terminal like this:

The program then asks you to define the amount of points you want to create and the interval in which these points should be created.

In the above image, we would plot the runtimes for a size n from 1 to 50 and the sample points would be generated in the interval [-50, 50].
The images will be saved in the /plots subfolder, which is included in the project folder.
