Stop losing your repository traffic data.
GitHub only shows views, clones, and referrers for the last 14 days. Want to see trends from last month? You can't.
This dashboard solves that.
- Archives everything – daily snapshots of views, clones, and referrers
- Stores forever – all data saved as CSV in your own private repo
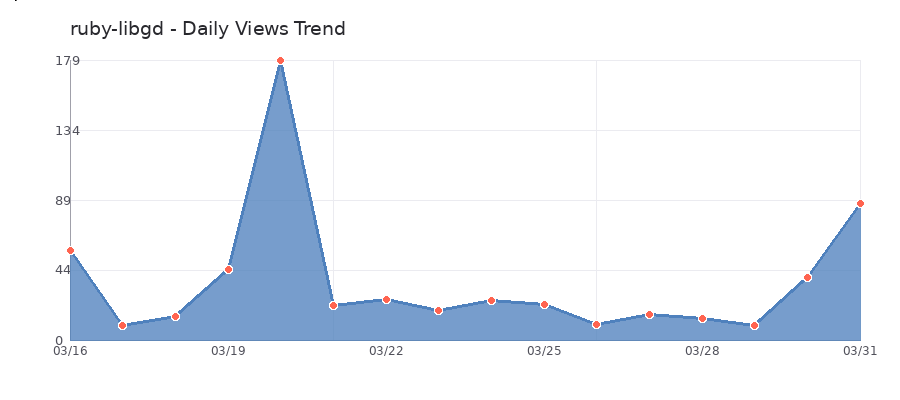
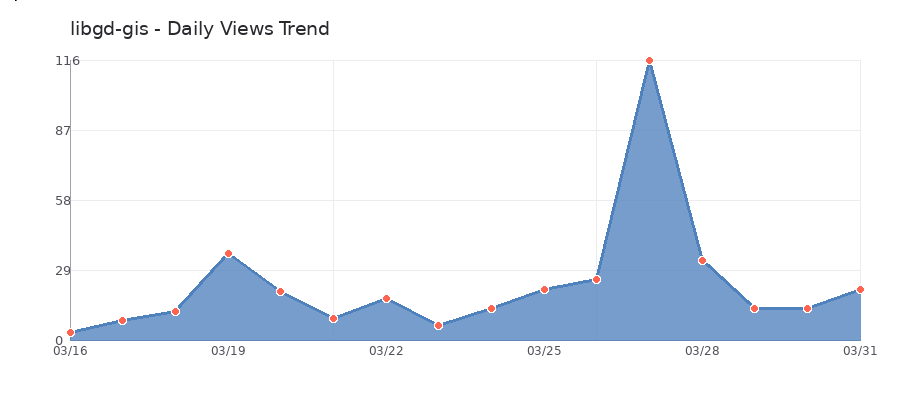
- Generates charts – beautiful trend graphs using ruby-libgd (no JavaScript!)
- Runs automatically – GitHub Actions does the work daily
- Live dashboard – auto-deploys to GitHub Pages
ruby-libgd https://ggerman.github.io/github-metrics-dashboard/ruby-libgd_views_trend.png
libgd-gis https://ggerman.github.io/github-metrics-dashboard/libgd-gis_views_trend.png
Live dashboard: https://ggerman.github.io/github-metrics-dashboard
-
Clone this repository
-
Edit config.yml with your repositories: owner: your_username name: your_repo display_name: My Project
-
Create a GitHub token with repo scope
-
Add secrets to your repository: GH_TOKEN = your token METRICS_VAULT_TOKEN = same token
-
Enable GitHub Pages (Settings -> Pages -> Source: GitHub Actions)
-
Run workflows from Actions tab: Archive Metrics -> Run workflow Generate Dashboard -> Run workflow
Your dashboard will be live at: https://your-username.github.io/github-metrics-dashboard
ruby-libgd: 469 views, 119 clones, +68% WoW libgd-gis: 332 views, 232 clones, +110% WoW
- ruby-libgd – pure Ruby chart generation
- Octokit – GitHub API client
- GitHub Actions – automation
- GitHub Pages – hosting
MIT
German A. Gimenez Silva ggerman@gmail.com https://github.com/ggerman
Your metrics should be yours forever. Now they are.