![]()
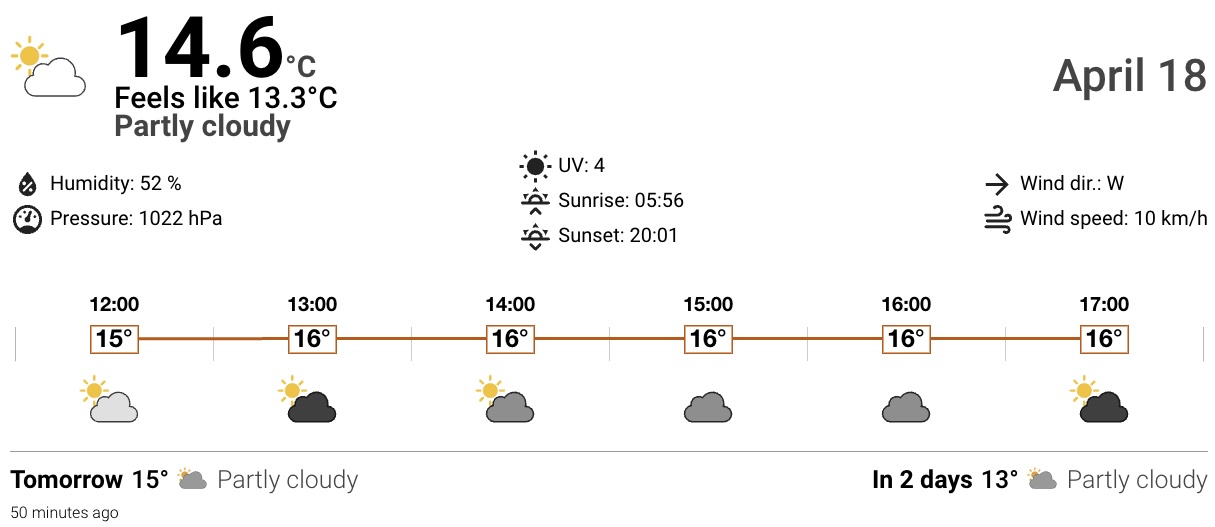
A Home Assistant weather card optimised for e-ink displays, based on mlamberts78/weather-chart-card. Features configurable font sizes, e-ink colour modes, daily summaries, and full translation support.

This card is available in HACS (Home Assistant Community Store). HACS is a third party community store and is not included in Home Assistant out of the box.
| Name | Type | Default | Description |
|---|---|---|---|
| type | string | Required | Should be custom:eink-weather-card. |
| entity | string | Required | An entity_id with the weather domain. |
| temp | string | none | An entity_id for a custom temperature sensor. |
| press | string | none | An entity_id for a custom pressure sensor. |
| humid | string | none | An entity_id for a custom humidity sensor. |
| uv | string | none | An entity_id for a custom UV index sensor. |
| winddir | string | none | An entity_id for a custom wind bearing sensor. Sensor should have value in degrees |
| windspeed | string | none | An entity_id for a custom wind speed sensor. |
| feels_like | string | none | An entity_id for a custom feels like temperature sensor. |
| dew_point | string | none | An entity_id for a custom dew point sensor. |
| wind_gust_speed | string | none | An entity_id for a custom wind gust speed sensor. |
| visibility | string | none | An entity_id for a custom visibility sensor. |
| cloud_coverage | string | none | An entity_id for a cloud coverage sensor (%). Shades the cloudy/partly-cloudy icons from white (outlined) to dark based on coverage. If the sensor exposes a forecast attribute (array of hourly values), the chart's forecast icons and daily-summary icons are shaded index-by-index too. Falls back to the weather entity's cloud_coverage attribute and to per-forecast-item cloud_coverage values when available. Safe to omit. |
| description | string | none | An entity_id for a custom weather description sensor. |
| title | string | none | Card title. |
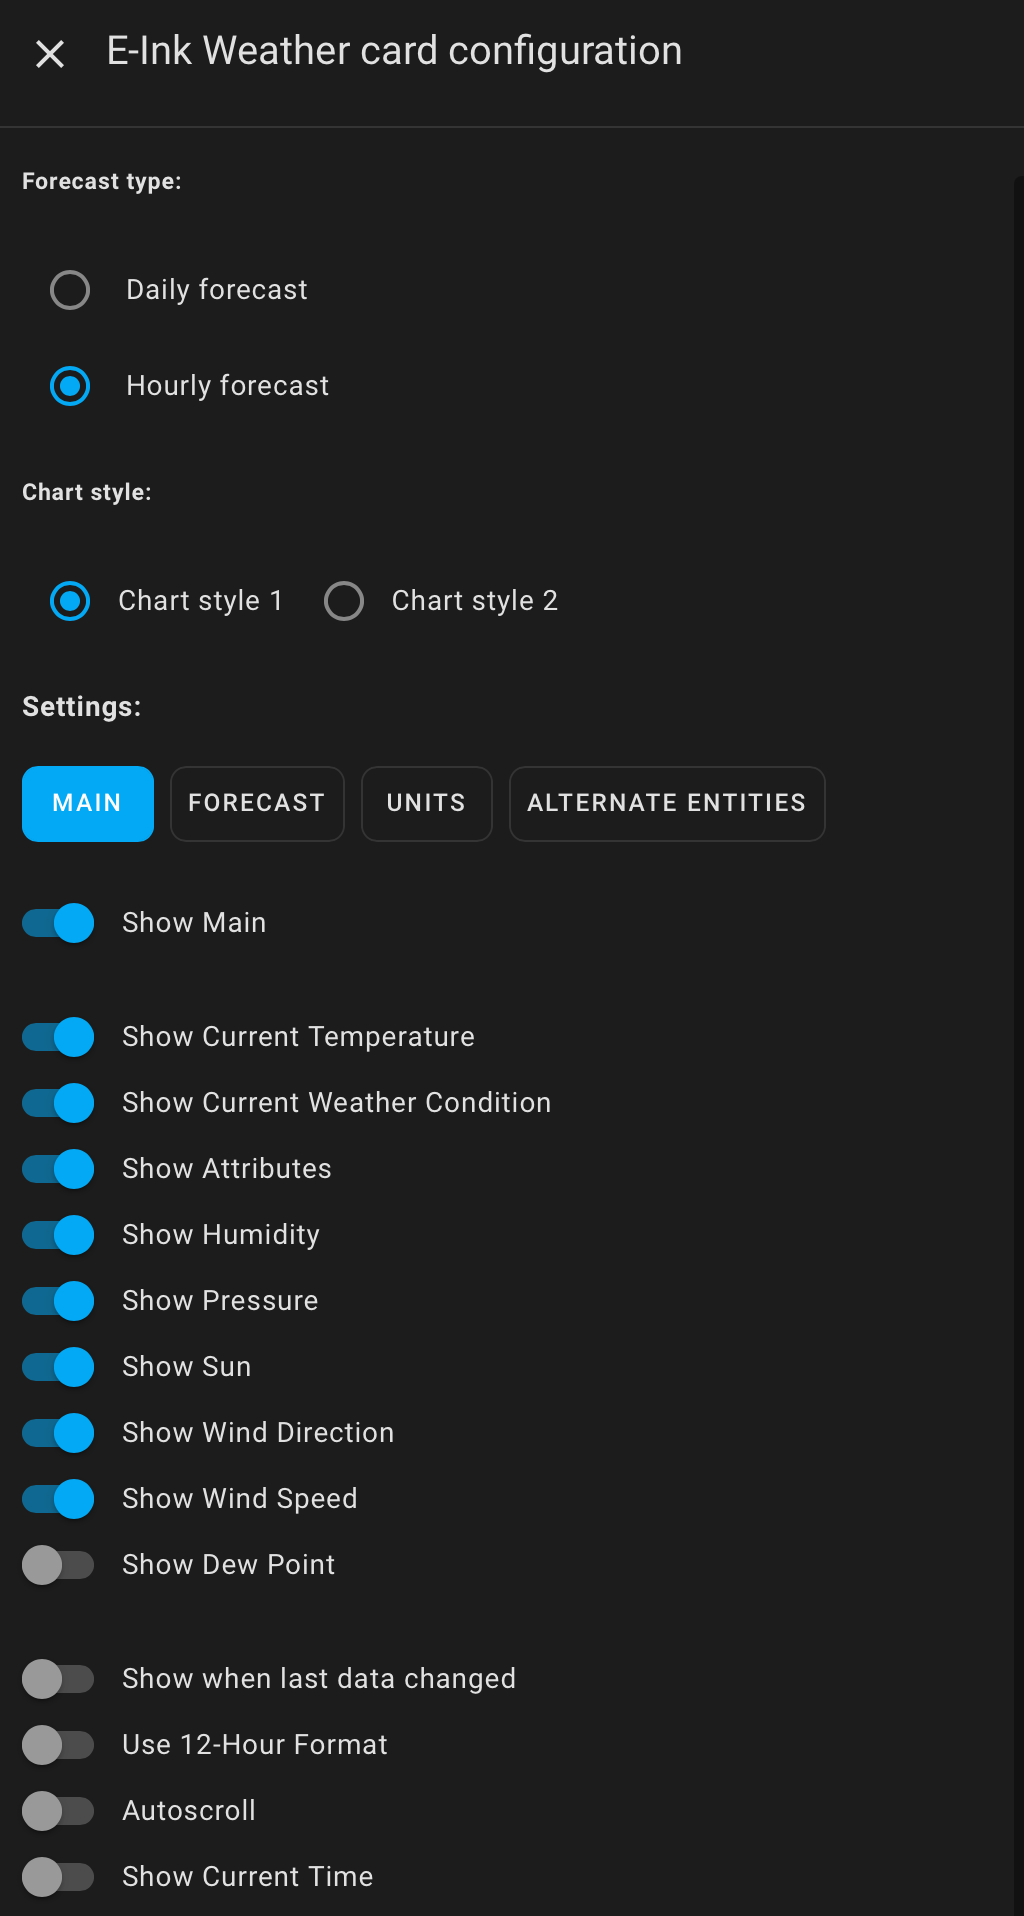
| show_main | boolean | true | Show or hide a section with current weather condition and temperature. |
| show_temperature | boolean | true | Show or hide the current temperature. |
| show_current_condition | boolean | true | Show or hide the current weather condition. |
| show_attributes | boolean | true | Show or hide a section with attributes such as pressure, humidity, wind direction and speed, etc. |
| show_sun | boolean | true | Show or hide the sunset information |
| show_time | boolean | false | Show or hide the current time on the card. |
| show_time_seconds | boolean | false | Show or hide seconds for the current time on the card. |
| show_day | boolean | false | Show or hide the current day on the card. (Only visible when show_time is true.) |
| show_date | boolean | false | Show or hide the current date the card. (Only visible when show_time is true.) |
| show_humidity | boolean | true | Show or hide humidity on the card. |
| show_pressure | boolean | true | Show or hide pressure on the card. |
| show_wind_direction | boolean | true | Show or hide wind_direction on the card. |
| show_wind_speed | boolean | true | Show or hide wind_speed on the card. |
| show_feels_like | boolean | false | Show or hide feels like temperature on the card. |
| show_dew_point | boolean | false | Show or hide dew point on the card. |
| show_wind_gust_speed | boolean | false | Show or hide wind gust speed on the card. |
| show_visibility | boolean | false | Show or hide visibility on the card. |
| show_description | boolean | false | Show or hide the weather description on the card. |
| show_last_changed | boolean | false | Show or hide when last data changed on the card. |
| use_12hour_format | boolean | false | Display time in 12-hour format (AM/PM) instead of 24-hour format. |
| icons | string | none | Path to the location of custom icons in svg format, for example /local/weather-icons/. |
| animated_icons | boolean | false | Enable the use of animated icons |
| icon_style | string | 'style1' | Options are 'style1' and'style2' for different set of animated icons. |
| icons_size | number | 25 | The size of the animated or custom icons in pixels. |
| current_temp_size | number | 28 | The size of the current temperature in pixels. |
| condition_text_size | number | 18 | The size of the weather condition text in pixels. |
| feels_like_text_size | number | 13 | The size of the feels-like temperature text in pixels. |
| description_text_size | number | 13 | The size of the weather description text in pixels. |
| attributes_text_size | number | 14 | The size of the attributes text (humidity, pressure, etc.) in pixels. |
| attributes_icon_size | number | 24 | The size of the attribute icons in pixels. |
| time_size | number | 26 | The size of the current time in pixels. |
| day_date_size | number | 15 | The size of the current day and date in pixels. |
| show_attribute_labels | boolean | false | Show text labels next to attribute icons (e.g. "Humidity:", "Pressure:"). Translated to all supported languages. |
| eink_mode | boolean | false | E-ink display mode: high contrast, bold text, thicker chart lines, disabled animations. |
| forecast | object | none | See forecast options for available options. |
| units | object | none | See units of measurement for available options. |
| locale | string | none | See Supported languages for available languages |
| autoscroll | boolean | false | Update the chart each hour, hiding prior forecast datapoints |
| Name | Type | Default | Description |
|---|---|---|---|
| precipitation_type | string | rainfall | Show precipitation in 'rainfall' or 'probability'. |
| show_probability | boolean | false | Also show probability value when precipitation_type = rainfall. (Only when available) |
| labels_font_size | number | 11 | Font size for temperature and precipitation labels. |
| precip_bar_size | number | 100 | Adjusts the thickness of precipitation bars (1-100). |
| temperature1_color | string | rgba(255, 152, 0, 1.0) | Temperature first line chart color. |
| temperature2_color | string | rgba(68, 115, 158, 1.0) | Temperature second line chart color. |
| precipitation_color | string | rgba(132, 209, 253, 1.0) | Precipitation bar chart color. |
| chart_datetime_color | string | primary-text-color | Chart day or hour color |
| chart_text_color | string | none | Chart text color |
| chart_height | number | 180 | Adjust the forecast chart height |
| precip_expand_height | number | 0 | Extra chart height (px) added when precipitation is in the forecast. |
| chart_line_width | number | 1.5 | Temperature line thickness in the chart. |
| chart_point_radius | number | 2 | Data point radius in the chart. |
| chart_ticks_text_size | number | 14 | Font size for chart x-axis (date/time) labels. |
| condition_icons | boolean | true | Show or hide forecast condition icons. |
| show_wind_forecast | boolean | true | Show or hide wind forecast on the card. |
| round_temp | boolean | false | Option for rounding the forecast temperatures |
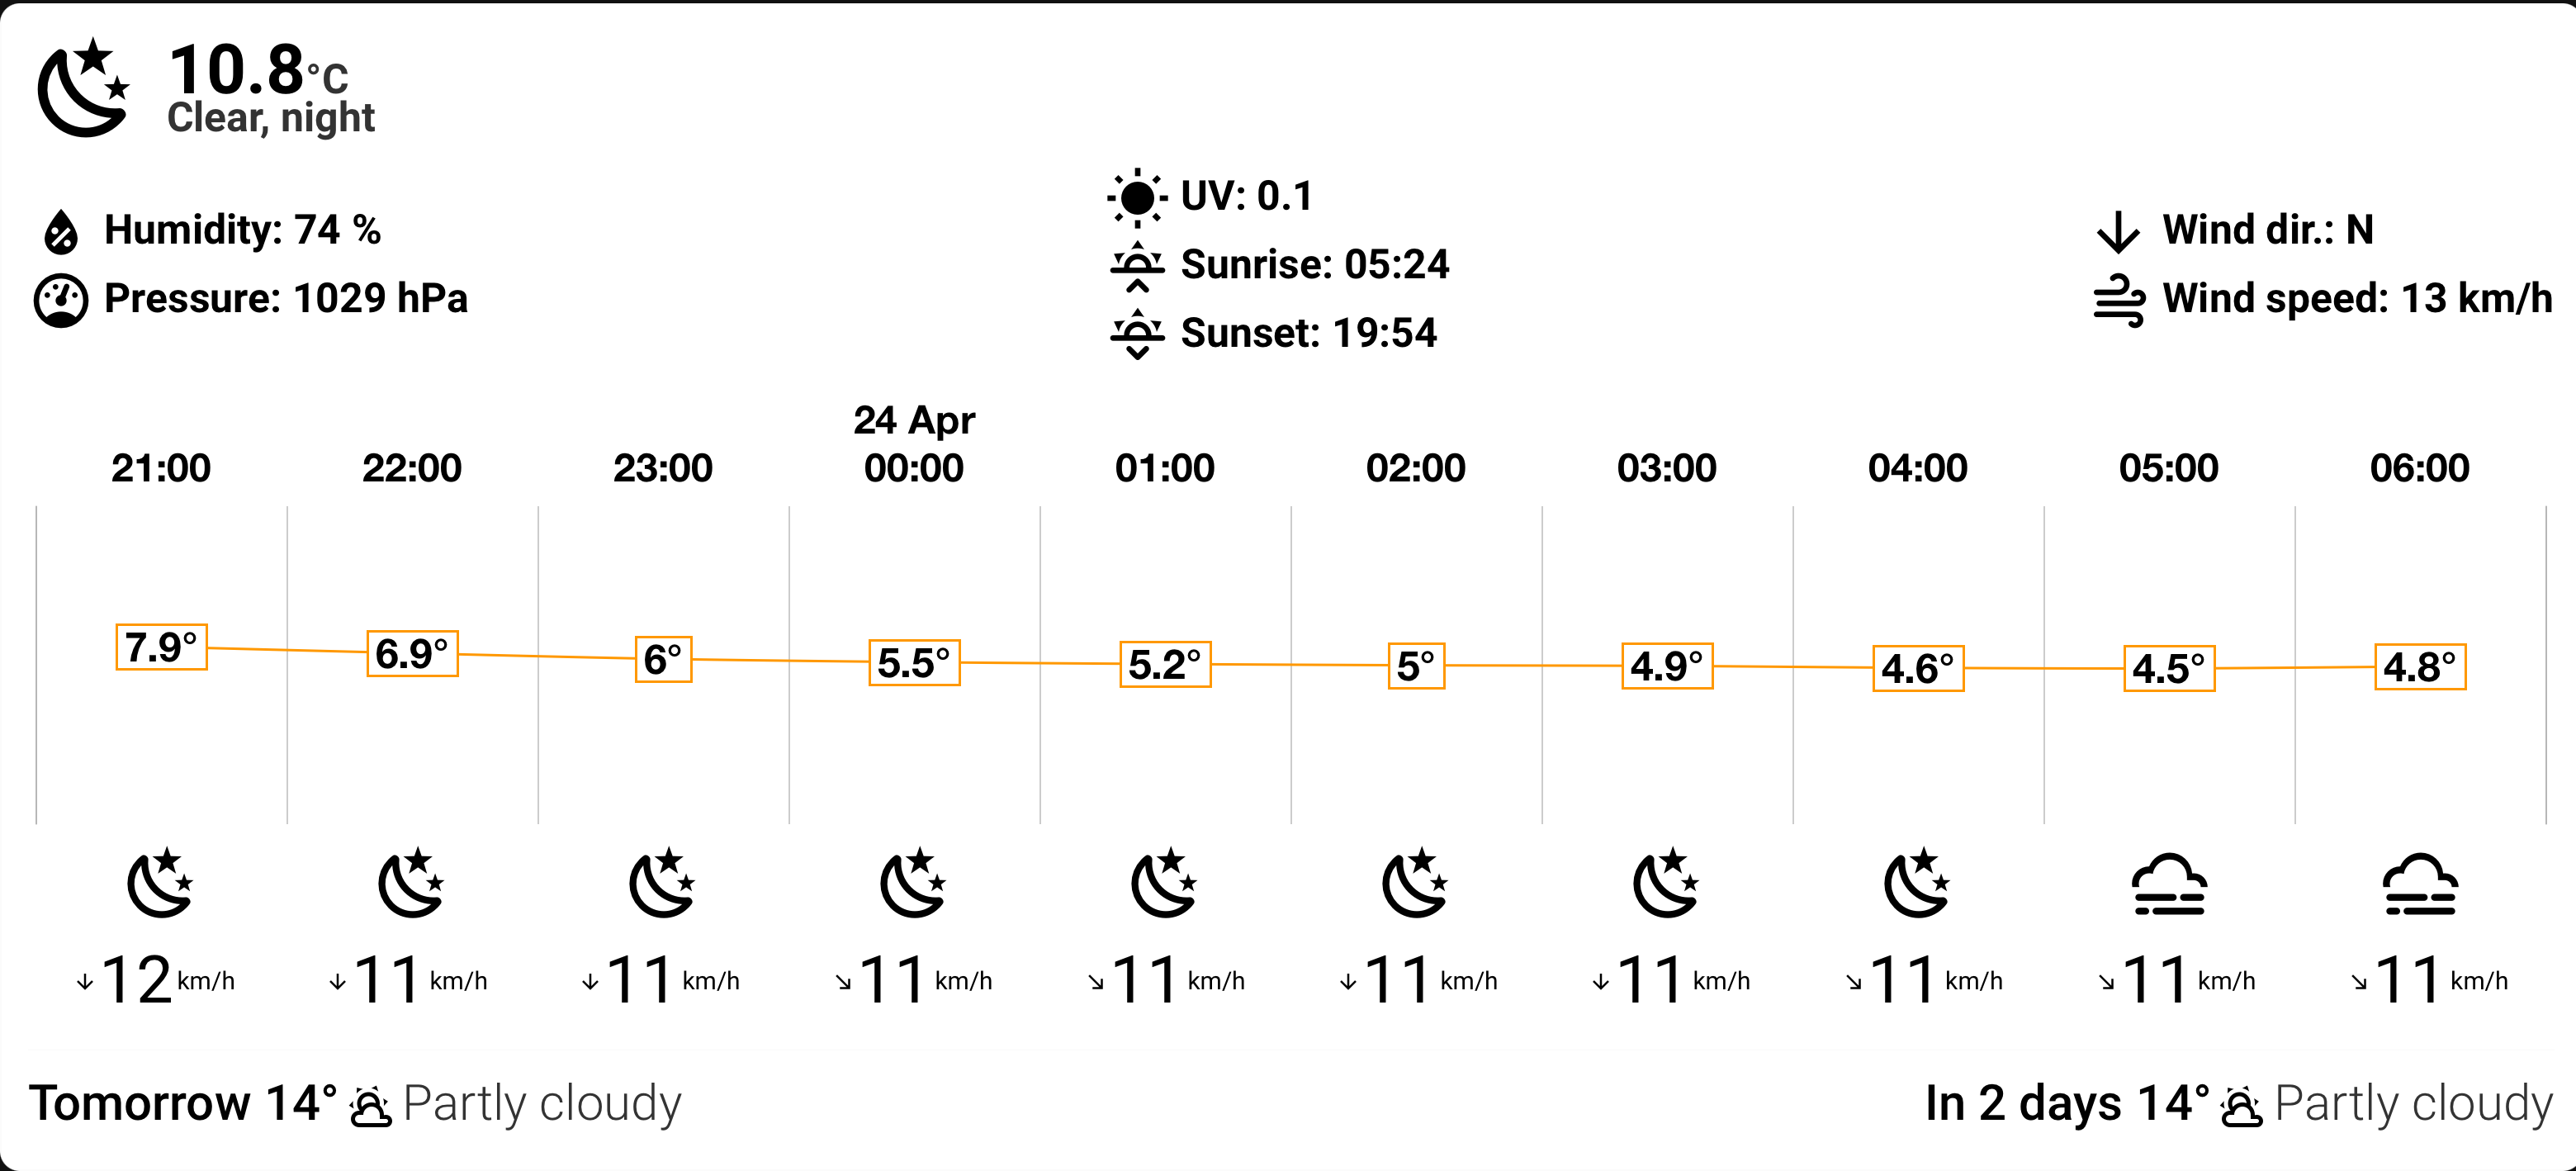
| style | string | style1 | Change chart style, options: 'style1' or 'style2' |
| type | string | daily | Show daily or hourly forecast if available, options: 'daily' or 'hourly' |
| number_of_forecasts | number | 0 | Overrides the number of forecasts to display. Set to "0" for automatic mode. |
| disable_animation | boolean | false | Disable the chart animation. |
| Name | Type | Default | Description |
|---|---|---|---|
| pressure | string | none | Convert to 'hPa' or 'mmHg' or 'inHg' |
| speed | string | none | Convert to 'km/h' or 'm/s' or 'Bft' or 'mph' |
Icons should be in svg format. Icons should have names as shown here. Example:


type: custom:eink-weather-card
entity: weather.weather_home
show_time: true
show_day: true
show_date: true
animated_icons: true
icon_style: style1

type: custom:eink-weather-card
entity: weather.my_home
forecast:
  style: style2
type: custom:eink-weather-card
entity: weather.my_home
show_main: false
show_attributes: false
forecast:
  condition_icons: false
  show_wind_forecast: false
type: custom:eink-weather-card
entity: weather.my_home
units:
  pressure: mmHg
speed: m/sFeed the card a cloud-coverage sensor that exposes the current value as its state and an hourly forecast array as the forecast attribute. Per-hour values drive the colour of each forecast column icon (and the daily-summary icons when the chart is in hourly mode). The main icon uses the sensor's state.
Template sensor example (uses the weather.get_forecasts action to pull an hourly array from the weather entity):
template:
  - trigger:
      - platform: time_pattern
        minutes: /15
      - platform: homeassistant
        event: start
    action:
      - action: weather.get_forecasts
        data:
          type: hourly
        target:
          entity_id: weather.home
        response_variable: hourly
    sensor:
      - name: Cloud Coverage Hourly
        unique_id: cloud_coverage_hourly
        state: "{{ state_attr('weather.home', 'cloud_coverage') | float(0) }}"
        unit_of_measurement: "%"
        attributes:
          forecast: "{{ hourly['weather.home'].forecast | map(attribute='cloud_coverage') | list }}"
Then point the card at it via the Alternate entities tab (or in YAML):
type: custom:eink-weather-card
entity: weather.home
cloud_coverage: sensor.cloud_coverage_hourly
forecast:
  type: hourly
Shade bands (0–100%): <45 white with thin outline, 45–65 light grey, 65–85 medium grey, ≥85 dark grey. If the sensor is missing or produces non-numeric values, shading is skipped and the default icons render unchanged.
| Language | Locale |
|---|---|
| Bulgarian | bg |
| Catalan | ca |
| Czech | cs |
| Danish | da |
| Dutch | nl |
| English | en |
| Finnish | fi |
| French | fr |
| German | de |
| Greek | el |
| Hungarian | hu |
| Italian | it |
| Lithuanian | lt |
| Norwegian | no |
| Polish | pl |
| Portuguese | pt |
| Romanian | ro |
| Russian | ru |
| Slovak | sk |
| Spanish | es |
| Swedish | sv |
| Ukrainian | uk |
| 한국어 | ko |
type: custom:eink-weather-card
entity: weather.home
eink_mode: true
show_attribute_labels: true
current_temp_size: 48
condition_text_size: 28
feels_like_text_size: 20
attributes_text_size: 20
attributes_icon_size: 30
icons_size: 40
forecast:
  labels_font_size: 20
  chart_ticks_text_size: 20
  chart_height: 250
  chart_line_width: 3
  chart_point_radius: 4