
- Table of Contents
- Abstract
- Illustration
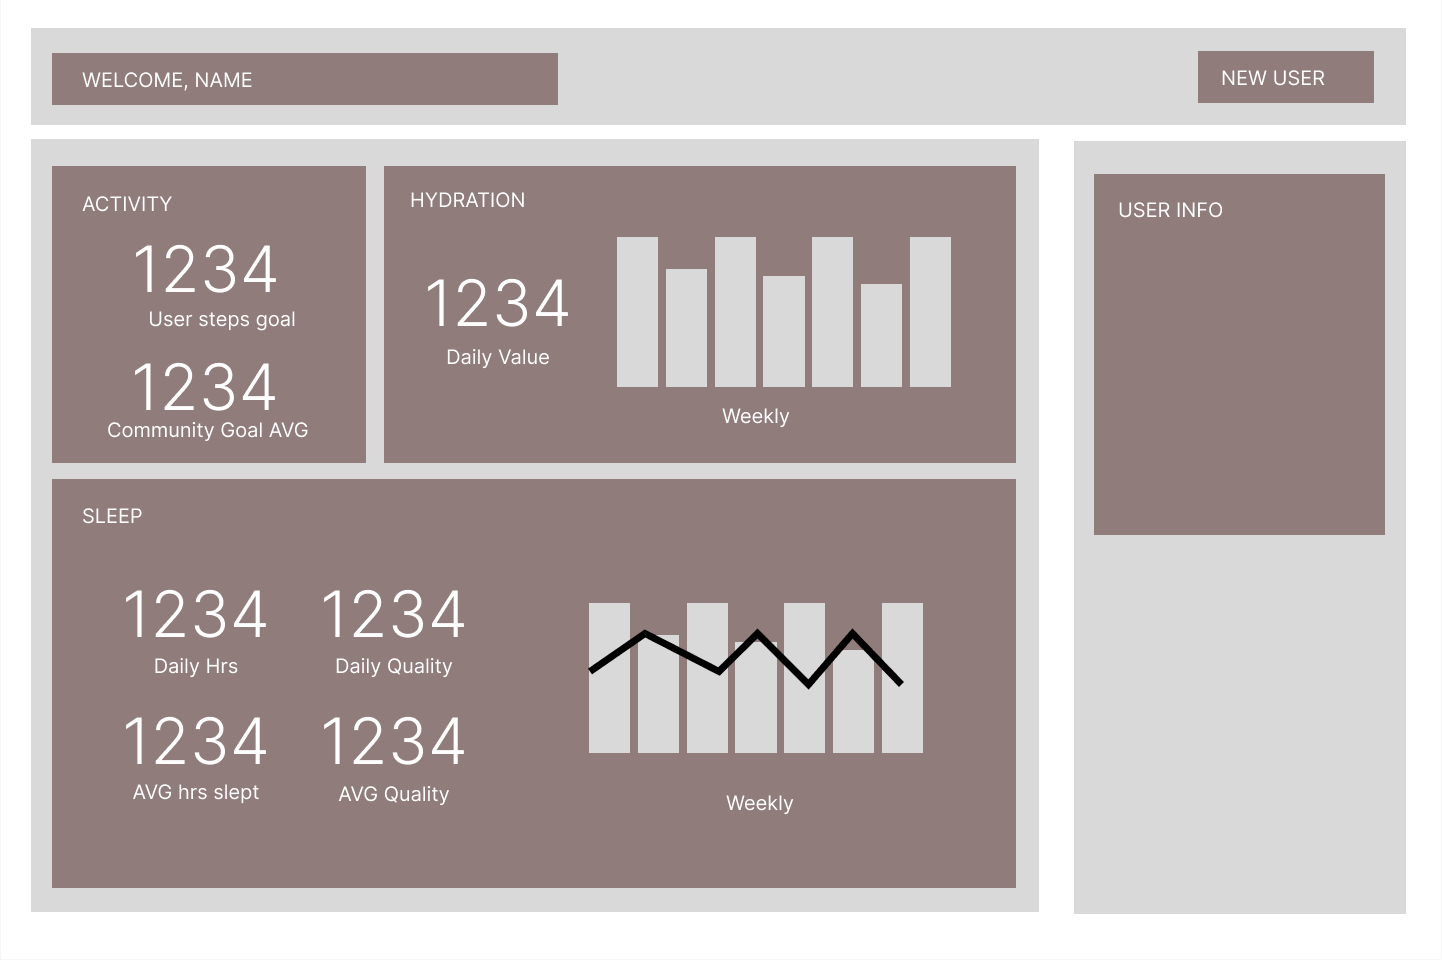
- Wireframe
- Technologies Used
- Context and Features
- Lessons Learned
- Future Features
- Application Set-Up
- Contributor LinkedIn and GitHub
- Project Specs
- The HealthHub Project was designed to test my fellow project collaborators and I on our abilities to implement ES6 classes, use array and object prototype methods for data manipulation, create an easy to use and understand dashboard with clearly displayed information, make network requests to retrieve and
POSTdata, practice our TDD skills with Mocha/Chai, implement instructor feedback, and implementing error handling and accessibility features. It’s a health and wellness application that showcases hydration, sleep, and activity data for a random user. It also displays averages for said data amonst all user's.
- Chart.js
- CSS
- HTML
- Fetch API
- JavaScript
- Mocha & Chai
- Normalize.css
- Webpack
-
HealthHub is a health and wellness application. Upon page load, the site displays a user’s information (name, address, and email), hydration data, and sleep data. It compares their daily step goal to an average amongst a database of users. The site also greets the user by their first name at the top of the web page. This application was created using Webpack, which is a modular bundler used to group HTML, CSS, and JavaScript files into more efficient files for a browser to read. It also accounts for npm packages, which our application includes many of.
-
We made use of many packages to bring our application together including
Normalize.cssandCharts.js. TheNormalize.csspackage allowed us to make our application render more consistently on different browsers. TheCharts.jspackage allowed us to create charts that represent our weekly data for user hydration and sleep patterns. Both of these charts are dynamic and generated based on the data for a specific user. They are displayed in our HealthHub widgets. The widgets also display daily and average information for each respective data type in an appealing and eye catching manner. -
We implemented Test Driven Development into our development process for this application. All of our classes that were built to accommodate our respective data types were thoroughly tested using the mocha testing framework and the chai assertion library. In order for us to test the data that we fetched from our provided API’s properly, we decided to take a sample size from the data for each API, and test all of the data locally. However, we made all of our methods dynamic in order to ensure that said methods would work for the larger data sets provided to us by our API’s. Fetching the data from said API’s is what allows our application to
GETand display said data for 50 different users over years of time. -
Some new features that we added in our second version of HealthHub include an activity class that displays the user’s daily step goal, daily number of steps, daily minutes active, daily miles walked, and their weekly average active minutes. We also added a new Community Stats widget which includes average activity stats for the entire user community. Our activity widget included two brand new charts, courtesy of
Charts.js. In addition to this new information, my colleagues and I added some exciting new features. A user is able to createPOSTrequests, and post their own health data to our local API as well as the DOM. This is done by clicking one of our add buttons at the top right hand corner of our widgets. Upon clicking one of these buttons, a dialog form opens up for the user. They are prompted to enter the respective data for that widgit. After entering their data, their new information is displayed on the DOM. Lastly, we were able to implement some error handling and accessibility features. Our application scored a 100% accessibility rating in a Lighthouse Accessibility Audit.
-
Building this application introduced many new concepts to my fellow collaborators and I. This was our first time using Webpack, installing npm packages, and fetching data from API’s. Running Webpack from our console’s had somewhat of a learning curve to it, but seeing how it updated our application in real time was very satisfying. Knowing that it allowed us to install and make use of some wonderfully robust npm packages makes Webpack appear superior, and better to use than merely running index.html files locally. Although this wasn’t our first time writing test assertions for classes, the scope of this project was certainly larger than any my fellow collaborators and I have tackled in the past. The amount of tests and methods that we all wrote were certainly wins for us, especially the ones that made use of prototype iterator methods.
-
The most challenging aspect of the first part of our project was writing network requests to fetch data from the provided API’s. The syntax on these GET requests were initially very tricky for my collaborators and I to write. We had to make use of the
then()prototype method in conjunction with thejson()method to resolve promises and parse the data into a usable and applicable form. We also made sure to include thecatch()method in all of our fetch API functions. Lastly, the trickiest part of this entire process was tieing the data from our API’s together with our data model and our DOM. We did so by incorporating the data from our API calls into our pre-developed classes, and writing a function in ourscripts.jsfile that made one final use of.then()to tie our data to our class instances inscripts.js. This allowed us to manipulate and display said data on our DOM. Accessing and connecting all of this data was a challenging but rewarding learning experience for my fellow collaborators and I. -
The second version of our HealthHub project tested us even further in our abilities to work with API’s, build and thoroughly test a class, implement some error handling, and make our project accessibility friendly. A certain method in our Activity class tasked us with getting the average value of three different properties from our Activity data set. This was a particularly challenging method that pushed my fellow collaborators and I to think very critically about what iterator methods we could apply to our data set to get us the information that we needed. Another aspect of this second version was the implementation and use of
POSTnetwork requests. This was our first time utilizingPOSTrequests in a project to update the data in local API’s, and having said data show up on our DOM as well as our data set. We leveraged the use of dialog and form tags in our HTML, as well as many different functions and event listeners in our main JavaScript file. This was certainly a challenging task, but it allowed my collaborators and I to really push ourselves, and learn new ways to accomplish the objectives we were tasked with. The results speak for themselves, and although there is more we would like to implement in the future we are still very proud of what we achieved.
Some future features we’d like to add to this application are:
- Fixing a bug related to posting and displaying new data on our charts.
- Having a step challenge between friends.
- Dragging and dropping displayed widgets.
- An admin view where an admin is able to view trends for all users.
- Implement an animation using CSS and/or make your application responsive on smaller screen sizes.
-
Fork repository on GitHub.
-
Git clonethe repository to your local machine. -
Cdinto the directory. -
Run
npm installin your terminal to install project dependencies. -
Go to this repository
-
Follow instructions in the Fitlit-api repository from the previous step.
-
Run
npm startin the terminal to see the application. -
When finished with the application, be sure to type
Control + Cto stop running the Fitlip-api and this application.