
nano-benchmark provides command-line utilities for micro-benchmarking code
with nonparametric statistics and significance testing.
Four utilities are available:
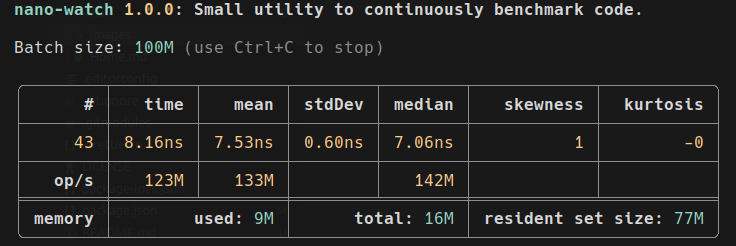
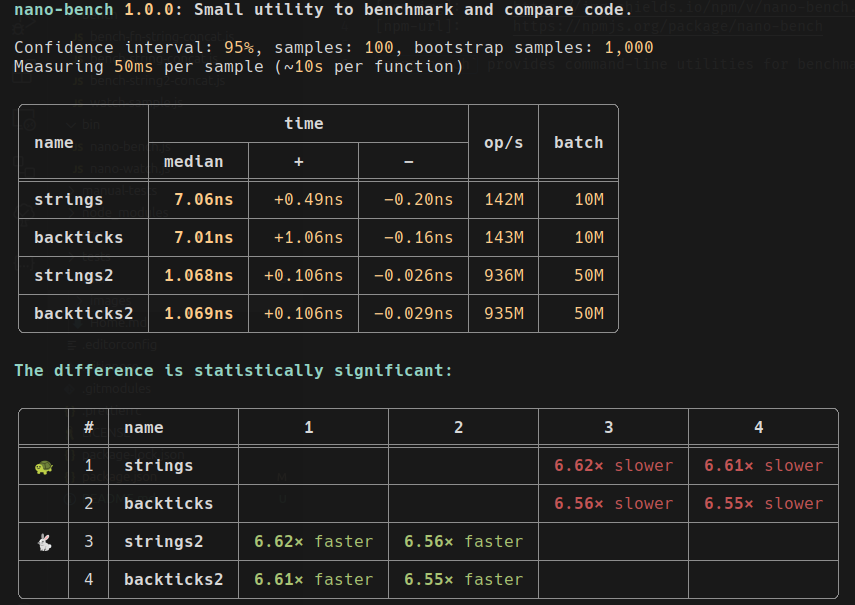
nano-watch— continuously benchmarks a single function, showing live statistics and memory usage.nano-bench— benchmarks and compares multiple functions, calculating confidence intervals and statistical significance.nano-bench-io— benchmarks slow (ms-scale) functions one call per run — distributions and tail percentiles (p90/p99), no batching.nano-bench-compare— views and compares saved results (JSON), recomputing significance from the raw samples — for before/after comparisons across runs.
Designed for performance tuning of small, fast code snippets used in tight loops.
npm install nano-benchmarkUse --self to get the script path for Deno and Bun:
npx nano-bench benchmark.js
bun `npx nano-bench --self` benchmark.js
deno run --allow-read --allow-hrtime `npx nano-bench --self` benchmark.js
deno run -A `npx nano-bench --self` benchmark.js
node `npx nano-bench --self` benchmark.js
For Deno, --allow-read is required and --allow-hrtime is recommended.
Use -A for convenience in safe environments.
With a global install (npm install -g nano-benchmark) both utilities are available by name.
Otherwise, prefix with npx (e.g., npx nano-watch) or add them to your package.json scripts.
Run with --help for details on arguments.
Both utilities import a module and benchmark its (default) export.
nano-bench expects an object whose properties are the functions to compare.
nano-watch accepts the same format or a single function.
Name one or more methods after the file to benchmark just those. A single method runs as a baseline — its statistics are reported with no significance test (there is nothing to compare it against in isolation).
Example module for nano-bench (bench-strings-concat.js):
export default {
  strings: n => {
    const a = 'a',
      b = 'b';
    for (let i = 0; i < n; ++i) {
      const x = a + '-' + b;
    }
  },
  backticks: n => {
    const a = 'a',
      b = 'b';
    for (let i = 0; i < n; ++i) {
      const x = `${a}-${b}`;
    }
  },
  join: n => {
    const a = 'a',
      b = 'b';
    for (let i = 0; i < n; ++i) {
      const x = [a, b].join('-');
    }
  }
};
Usage:
npx nano-bench bench-strings-concat.js                 # compare all three
npx nano-bench bench-strings-concat.js strings join    # compare just these two
npx nano-bench bench-strings-concat.js strings         # baseline one (no significance test)
npx nano-watch bench-strings-concat.js backticksBefore committing to a long collection run, validate the module with --smoke:
each selected function is called once (n = 1) and reported ok/failed with a
rough duration. The exit code is non-zero if any function throws or rejects,
and the tool exits promptly even if the module holds live handles (servers,
watchers):
npx nano-bench bench-strings-concat.js --smokeFor two functions nano-bench uses the Mann-Whitney U test; for three or more, the
Kruskal-Wallis H test with a Conover-Iman pairwise post-hoc. Because running many
pairwise comparisons inflates the chance of a false "significant", the post-hoc is
corrected for multiple comparisons by default. Choose the method with
--correction <none|holm|bonferroni> (default holm, which is uniformly more
powerful than Bonferroni); none reproduces an uncorrected post-hoc. For two
functions the effect size is reported next to the verdict (Cliff's δ with
a magnitude label, and how often the faster wins a random pair of runs) —
significance says a difference exists, the effect size says how much. Add -v /
--verbose to see the test statistic, critical value, and per-comparison α.
A median and confidence interval can't show multimodality, skew, or outlier tails
(GC pauses, JIT warmup). Pass --histogram to draw each function's sample
distribution inline in the terminal, on a shared scale so the shapes are comparable:
npx nano-bench bench-strings-concat.js --histogram                 # vertical columns
npx nano-bench bench-strings-concat.js --histogram --chart bars    # horizontal bars
npx nano-bench bench-strings-concat.js --histogram --bins 24       # override bin count
Use --no-emoji for ASCII markers on terminals with unreliable emoji widths.
Write a run to a JSON file with --json, then view or compare saved runs with
nano-bench-compare. Comparison recomputes significance from the raw samples (no
re-measuring), pairs same-named functions across files by default, and warns when the
runs' environments differ:
npx nano-bench bench-strings-concat.js --json before.json --label before
# ...change the code...
npx nano-bench bench-strings-concat.js --json after.json --label after

npx nano-bench-compare before.json after.json            # before/after, paired by name
npx nano-bench-compare before.json after.json --pooled   # one omnibus over all series
npx nano-bench-compare after.json                         # just re-render a saved run
The seed for the bootstrap is always recorded, so a recompare reproduces the original
intervals exactly. Add --host (or --host-name <name>) to stamp the machine into the
JSON.
Batching is right for nanosecond loops but erases the run-to-run distribution of
slow operations. nano-bench-io runs each function once per run (n = 1) and
reports p90/p99 tails alongside the median and its confidence interval — for
I/O-bound and other ms-scale code where the tail is the story:
npx nano-bench-io io-bench.js                # at least 10 runs and 5 s per function
npx nano-bench-io io-bench.js -r 50          # exactly 50 runs
npx nano-bench-io io-bench.js --stable 5     # run until the median CI is within 5%
The module format is the same. Optional prepare() / teardown() named exports
run untimed around every run. Warmup is auto-detected and discarded with a note
(--warmup N pins it, --warmup 0 keeps everything). Slow outliers are
flagged, distinguishing caching (slow first run) from interference (scattered
slow runs).
It also benchmarks whole commands (-c), with --prepare <cmd> running untimed
before every run — like hyperfine, but with nonparametric statistics and
tail percentiles:
npx nano-bench-io -c 'node script.js' 'bun script.js'Add -M / --metrics for per-run system metrics: CPU, page faults, and context
switches for module functions (any runtime); peak RSS, I/O bytes, and syscall
counts for commands (Linux).
Full documentation is in the wiki — browse the index, or search it by name.
Pass -o / --observe to nano-bench to emit
User Timing
marks at calibration and sampling phase boundaries. Marks are written to the
standard performance timeline and are observable via PerformanceObserver or
visible in DevTools / node --inspect traces — useful for correlating
benchmark variability with GC pauses, V8 optimization events, etc.
Mark / measure names follow nano-bench/<function-name>/<phase>, where phase is
find-level (calibration) or series / series-par (sample collection).
import {PerformanceObserver} from 'node:perf_hooks';

const obs = new PerformanceObserver(list => {
  for (const e of list.getEntries()) {
    console.log(e.name, e.duration.toFixed(2), 'ms');
  }
});
obs.observe({entryTypes: ['measure']});
Marks have a small fixed cost per phase (no per-sample overhead), so leaving
--observe on does not affect measurement accuracy. Default is off.
Library users can opt in directly: findLevel / benchmarkSeries /
benchmarkSeriesPar / measure / measurePar all accept an observe option
(boolean | string) — false / unset for no marks, true for the default
label, or a string for a custom label.
AI agents and AI-assisted developers: read AGENTS.md first for project rules and conventions.
Other useful files:
- ARCHITECTURE.md — module map, dependency graph, how benchmarking works.
- CONTRIBUTING.md — development workflow and coding conventions.
- llms.txt — project summary for LLMs.
- llms-full.txt — detailed CLI reference for LLMs.
BSD 3-Clause License
- 1.2.0: Added
nano-bench-iofor slow (ms-scale) functions and whole commands: per-run collection with p90/p99 tails, system metrics, warmup auto-detection, and multimodal cluster splitting. Added the--smokepre-flight and effect sizes (Cliff's δ). Bugfixes. - 1.1.0: Added saving to JSON,
nano-bench-comparefor comparing runs distribution histograms, and Holm/Bonferroni multiple-comparison. Also per-function selection and afindLeveltermination fix. - 1.0.16: Added User Timing API integration:
--observeflag. - 1.0.15: Updated dependencies.
- 1.0.14: Fixed Kruskal-Wallis post-hoc (Conover-Iman) pairwise comparison bug: corrected rank variance computation and critical value distribution. Added regression test.
- 1.0.13: Improved CLI help texts and documentation for brevity and clarity.
- 1.0.12: Added AI coding skills for writing benchmark files (write-bench, write-watch), shipped via npm. Added findLevel() tests. Expanded test suite.
- 1.0.11: Fixed MedianCounter.clone() bug, expanded test suite (204 tests), added CodeQL workflow, multi-OS CI matrix, and new Windsurf workflows.
- 1.0.10: Added Prettier lint scripts, GitHub issue templates, Copilot instructions, and Windsurf workflows.
- 1.0.9: Updated dependencies.
- 1.0.8: Updated dependencies.
- 1.0.7: Updated dependencies.
- 1.0.6: Updated dependencies.
- 1.0.5: Updated dependencies.
- 1.0.4: Updated dependencies + added more tests.
- 1.0.3: Updated dependencies.
- 1.0.2: Added the
--selfoption. - 1.0.1: Added "self" argument to utilities so it can be used with Deno, Bun, etc.
- 1.0.0: Initial release.
The full release notes are in the wiki: Release notes.